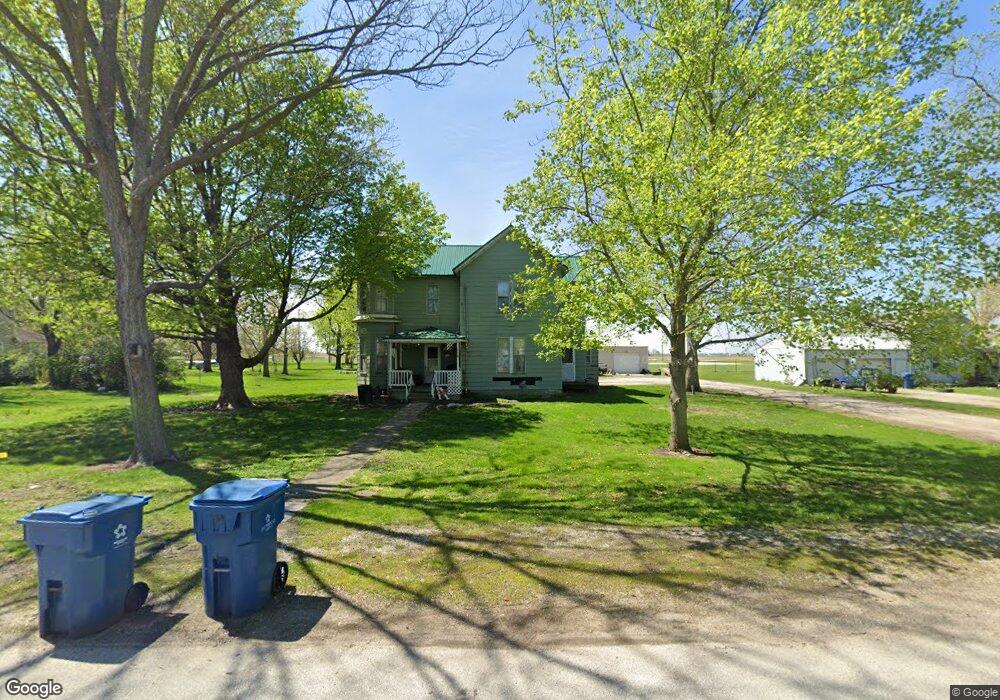
326 N Newton St Goodland, IN 47948
Estimated Value: $120,000 - $193,000
4
Beds
1
Bath
2,110
Sq Ft
$74/Sq Ft
Est. Value
About This Home
This home is located at 326 N Newton St, Goodland, IN 47948 and is currently estimated at $155,733, approximately $73 per square foot. 326 N Newton St is a home located in Newton County with nearby schools including South Newton Elementary School, South Newton Middle School, and South Newton Senior High School.
Ownership History
Date
Name
Owned For
Owner Type
Purchase Details
Closed on
May 5, 2021
Sold by
Andrew Getz
Bought by
Dane Juhl
Current Estimated Value
Home Financials for this Owner
Home Financials are based on the most recent Mortgage that was taken out on this home.
Interest Rate
2.98%
Purchase Details
Closed on
May 17, 2014
Sold by
Blue Skies Llc
Bought by
Brown Teresa and Best Jeremy
Purchase Details
Closed on
Oct 29, 2013
Sold by
Newton County Aduitor
Bought by
Blue Skies Llc
Create a Home Valuation Report for This Property
The Home Valuation Report is an in-depth analysis detailing your home's value as well as a comparison with similar homes in the area
Home Values in the Area
Average Home Value in this Area
Purchase History
| Date | Buyer | Sale Price | Title Company |
|---|---|---|---|
| Dane Juhl | $46,400 | -- | |
| Brown Teresa | -- | -- | |
| Blue Skies Llc | $1,700 | -- |
Source: Public Records
Mortgage History
| Date | Status | Borrower | Loan Amount |
|---|---|---|---|
| Closed | Dane Juhl | -- |
Source: Public Records
Tax History Compared to Growth
Tax History
| Year | Tax Paid | Tax Assessment Tax Assessment Total Assessment is a certain percentage of the fair market value that is determined by local assessors to be the total taxable value of land and additions on the property. | Land | Improvement |
|---|---|---|---|---|
| 2024 | $400 | $62,200 | $18,700 | $43,500 |
| 2023 | $394 | $59,000 | $18,700 | $40,300 |
| 2022 | $439 | $58,800 | $18,700 | $40,100 |
| 2021 | $429 | $53,300 | $15,200 | $38,100 |
| 2020 | $1,078 | $53,400 | $15,200 | $38,200 |
| 2019 | $1,719 | $85,300 | $15,200 | $70,100 |
| 2018 | $1,720 | $85,400 | $15,200 | $70,200 |
| 2017 | $1,630 | $80,900 | $10,800 | $70,100 |
| 2016 | $1,494 | $74,100 | $10,800 | $63,300 |
| 2014 | $1,327 | $71,100 | $12,100 | $59,000 |
| 2013 | $1,327 | $68,000 | $12,100 | $55,900 |
Source: Public Records
Map
Nearby Homes
- 330 N Newton St
- 330 N Newton St Unit 1
- 318 N Newton St
- 327 N Newton St
- 323 N Newton St
- 334 N Newton St
- 319 N Newton St
- 314 N Newton St
- 331 N Newton St
- 315 N Newton St
- 404 N Newton St
- 401 N Newton St
- 313 N Newton St
- 313 N Newton St Unit 1
- 408 N Newton St
- 310 N Newton St
- 407 N Newton St
- 309 N Newton St
- 324 N James St
- 316 N James St