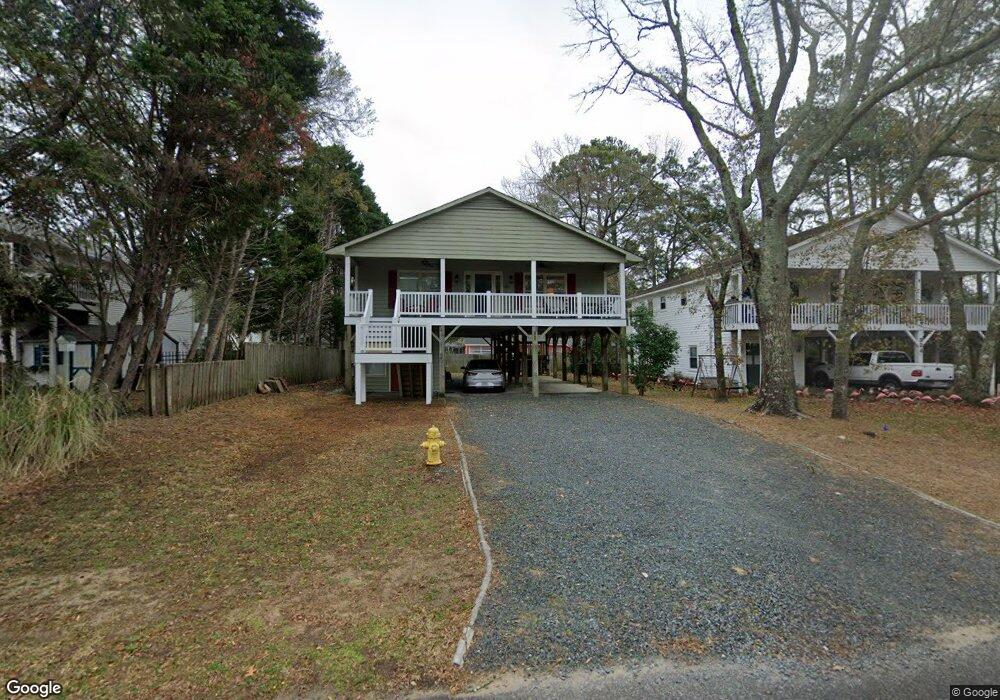
326 NE 50th St Oak Island, NC 28465
Estimated Value: $471,000 - $639,000
3
Beds
2
Baths
1,401
Sq Ft
$398/Sq Ft
Est. Value
About This Home
This home is located at 326 NE 50th St, Oak Island, NC 28465 and is currently estimated at $557,257, approximately $397 per square foot. 326 NE 50th St is a home located in Brunswick County with nearby schools including Southport Elementary School, South Brunswick Middle School, and South Brunswick High School.
Ownership History
Date
Name
Owned For
Owner Type
Purchase Details
Closed on
Dec 1, 2014
Sold by
Howle Reese Howard and Howle Lisa
Bought by
Finch Terry Wayne and Finch Sharon Haire
Current Estimated Value
Home Financials for this Owner
Home Financials are based on the most recent Mortgage that was taken out on this home.
Original Mortgage
$168,300
Interest Rate
4.04%
Mortgage Type
New Conventional
Purchase Details
Closed on
Jan 1, 1993
Bought by
Howle Charles Howard Et Martha Ann
Create a Home Valuation Report for This Property
The Home Valuation Report is an in-depth analysis detailing your home's value as well as a comparison with similar homes in the area
Home Values in the Area
Average Home Value in this Area
Purchase History
| Date | Buyer | Sale Price | Title Company |
|---|---|---|---|
| Finch Terry Wayne | $187,000 | None Available | |
| Howle Charles Howard Et Martha Ann | $80,000 | -- |
Source: Public Records
Mortgage History
| Date | Status | Borrower | Loan Amount |
|---|---|---|---|
| Previous Owner | Finch Terry Wayne | $168,300 |
Source: Public Records
Tax History Compared to Growth
Tax History
| Year | Tax Paid | Tax Assessment Tax Assessment Total Assessment is a certain percentage of the fair market value that is determined by local assessors to be the total taxable value of land and additions on the property. | Land | Improvement |
|---|---|---|---|---|
| 2025 | $1,965 | $462,010 | $165,000 | $297,010 |
| 2024 | $1,965 | $462,010 | $165,000 | $297,010 |
| 2023 | $1,365 | $462,010 | $165,000 | $297,010 |
| 2022 | $1,365 | $225,740 | $63,000 | $162,740 |
| 2021 | $1,335 | $225,740 | $63,000 | $162,740 |
| 2020 | $1,310 | $225,740 | $63,000 | $162,740 |
| 2019 | $1,310 | $63,820 | $63,000 | $820 |
| 2018 | $1,051 | $40,820 | $40,000 | $820 |
| 2017 | $1,051 | $40,820 | $40,000 | $820 |
| 2016 | $1,026 | $40,820 | $40,000 | $820 |
| 2015 | $563 | $176,400 | $40,000 | $136,400 |
| 2014 | $484 | $157,975 | $45,000 | $112,975 |
Source: Public Records
Map
Nearby Homes