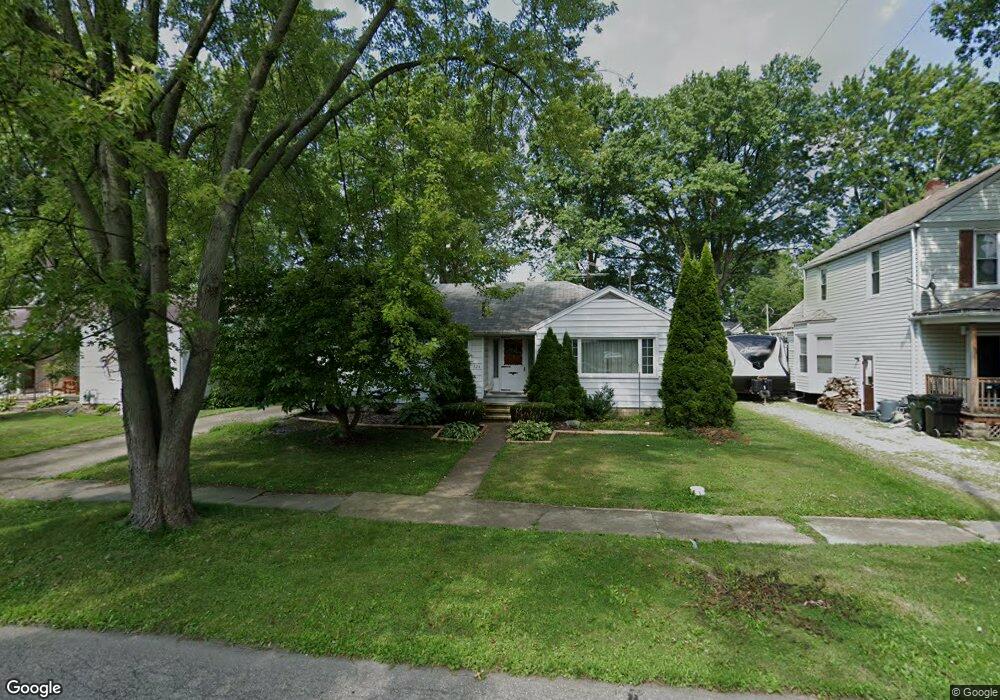
326 Olive St Elyria, OH 44035
Estimated Value: $139,000 - $184,000
About This Home
This home is located at 326 Olive St, Elyria, OH 44035 and is currently estimated at $157,758, approximately $126 per square foot. 326 Olive St is a home located in Lorain County with nearby schools including Ely Elementary School, Northwood Middle School, and Elyria High School.
Ownership History
We collect this data history from publicly available records. To have your information removed, we recommend requesting removal directly through your county’s website.
Purchase Details
Purchase Details
Home Financials for this Owner
Home Financials are based on the most recent Mortgage that was taken out on this home.Home Values in the Area
Average Home Value in this Area
Purchase History
We collect this data history from publicly available records. To have your information removed, we recommend requesting removal directly through your county’s website.
| Date | Buyer | Sale Price | Title Company |
|---|---|---|---|
| -- | None Listed On Document | ||
| $119,900 | First American |
Mortgage History
We collect this data history from publicly available records. To have your information removed, we recommend requesting removal directly through your county’s website.
| Date | Status | Borrower | Loan Amount |
|---|---|---|---|
| Previous Owner | $95,900 |
Tax History
We collect this data history from publicly available records. To have your information removed, we recommend requesting removal directly through your county’s website.
| Year | Tax Paid | Tax Assessment Tax Assessment Total Assessment is a certain percentage of the fair market value that is determined by local assessors to be the total taxable value of land and additions on the property. | Land | Improvement |
|---|---|---|---|---|
| 2024 | $1,643 | $44,506 | $13,321 | $31,185 |
| 2023 | $1,472 | $36,194 | $9,475 | $26,719 |
| 2022 | $1,490 | $36,194 | $9,475 | $26,719 |
| 2021 | $1,493 | $36,194 | $9,475 | $26,719 |
| 2020 | $1,276 | $29,620 | $7,750 | $21,870 |
| 2019 | $1,268 | $29,620 | $7,750 | $21,870 |
| 2018 | $1,804 | $29,620 | $7,750 | $21,870 |
| 2017 | $1,924 | $30,270 | $7,820 | $22,450 |
| 2016 | $1,899 | $30,270 | $7,820 | $22,450 |
| 2015 | $1,826 | $30,270 | $7,820 | $22,450 |
| 2014 | $1,838 | $30,830 | $7,960 | $22,870 |
| 2013 | $1,823 | $30,830 | $7,960 | $22,870 |
Map
- 375 Olive St
- 186 Pasadena Ave
- 167 Brandtson Ave
- 172 Brandtson Ave
- 179 Caroline St
- 225 Harwood St
- 127 Beebe Ave
- 208 Longfellow St
- 180 Cleveland St
- 517 Gulf Rd
- 164 Woodbury St
- 209 Gulf Rd
- 133 Coronado Ct
- 157 Fairlawn Ave
- 246 Hilliard Rd
- 436 Ambler Dr
- 169 Boston Ave
- 461 Augdon Dr
- 1 Smith Ct
- 1000 Gulf Rd
Ask me questions while you tour the home.