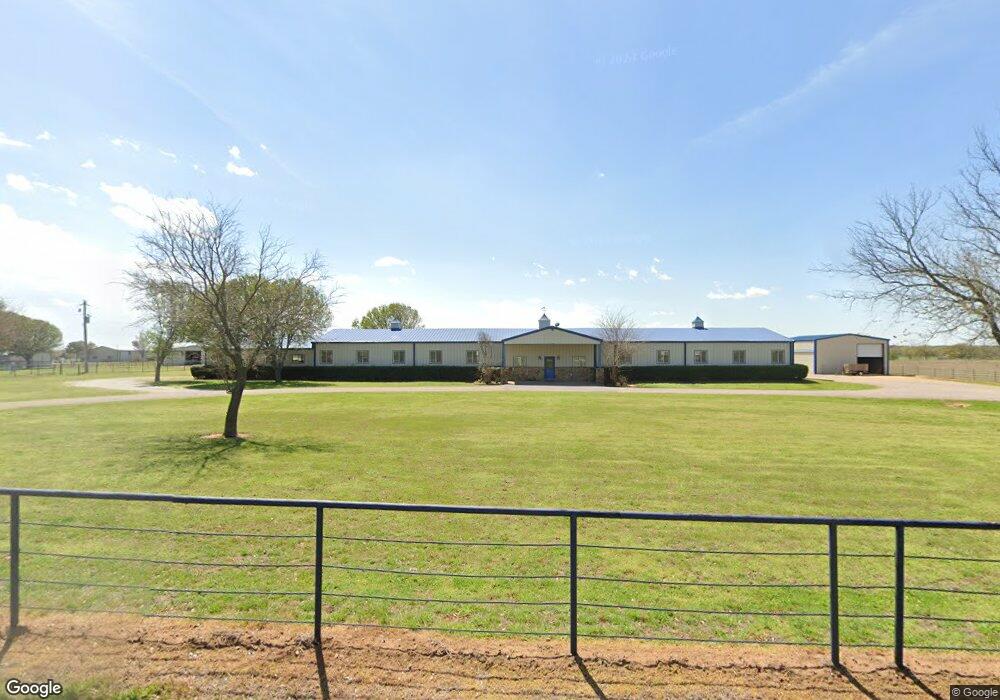
326 Orchard Rd Whitesboro, TX 76273
Estimated Value: $369,000 - $410,748
3
Beds
2
Baths
1,753
Sq Ft
$222/Sq Ft
Est. Value
About This Home
This home is located at 326 Orchard Rd, Whitesboro, TX 76273 and is currently estimated at $389,874, approximately $222 per square foot. 326 Orchard Rd is a home located in Grayson County with nearby schools including J.W. Hayes Primary School, Whitesboro Intermediate School, and Whitesboro Middle School.
Ownership History
Date
Name
Owned For
Owner Type
Purchase Details
Closed on
May 6, 2019
Sold by
Claudon John
Bought by
Donnell Joshua R and Stoudt Cameron A
Current Estimated Value
Home Financials for this Owner
Home Financials are based on the most recent Mortgage that was taken out on this home.
Original Mortgage
$261,250
Outstanding Balance
$168,242
Interest Rate
3.7%
Mortgage Type
New Conventional
Estimated Equity
$221,632
Purchase Details
Closed on
Dec 22, 2016
Sold by
Selway Inc
Bought by
Claudon John
Purchase Details
Closed on
May 1, 2015
Sold by
Selway Equine Therapy Center Ii Inc
Bought by
Selway Inc
Home Financials for this Owner
Home Financials are based on the most recent Mortgage that was taken out on this home.
Original Mortgage
$823,000
Interest Rate
3.74%
Mortgage Type
Purchase Money Mortgage
Create a Home Valuation Report for This Property
The Home Valuation Report is an in-depth analysis detailing your home's value as well as a comparison with similar homes in the area
Home Values in the Area
Average Home Value in this Area
Purchase History
| Date | Buyer | Sale Price | Title Company |
|---|---|---|---|
| Donnell Joshua R | -- | None Available | |
| Claudon John | -- | None Available | |
| Selway Inc | -- | Chapin Title Co Inc |
Source: Public Records
Mortgage History
| Date | Status | Borrower | Loan Amount |
|---|---|---|---|
| Open | Donnell Joshua R | $261,250 | |
| Previous Owner | Selway Inc | $823,000 |
Source: Public Records
Tax History Compared to Growth
Tax History
| Year | Tax Paid | Tax Assessment Tax Assessment Total Assessment is a certain percentage of the fair market value that is determined by local assessors to be the total taxable value of land and additions on the property. | Land | Improvement |
|---|---|---|---|---|
| 2025 | $2,316 | $143,208 | $47,244 | $95,964 |
| 2024 | $2,316 | $146,366 | $46,046 | $100,320 |
| 2023 | $2,114 | $150,612 | $43,596 | $107,016 |
| 2022 | $6,115 | $384,662 | $0 | $0 |
| 2021 | $6,179 | $343,784 | $45,000 | $298,784 |
| 2020 | $5,963 | $322,043 | $40,000 | $282,043 |
| 2019 | $13,756 | $693,314 | $118,946 | $574,368 |
| 2018 | $15,312 | $755,554 | $118,946 | $636,608 |
| 2017 | $14,689 | $714,806 | $118,946 | $595,860 |
| 2016 | $13,893 | $676,072 | $111,519 | $564,553 |
| 2015 | $13,224 | $638,118 | $111,519 | $526,599 |
| 2014 | $13,496 | $651,225 | $104,361 | $546,864 |
Source: Public Records
Map
Nearby Homes
- 20ac Us Hwy 377
- 262 Briar Creek Rd
- 2208 Sundance Rd
- 2026 Sundance Rd
- 2151 Sundance Rd
- 2256 Sundance Rd
- 2160 Sundance Rd
- 2244 Sundance Rd
- 2148 Sundance Rd
- 347 Copper Branch Rd
- 436 Dixie Rd
- 790 Ferguson Rd
- 1230 Dixie Estates Way
- TBD Bones Chapel Rd
- 1172 Dixie Estates Way
- 790 Bones Chapel Rd
- LOT 14 Dixie Estates Way
- LOT 20 Dixie Estates Way
- LOT 15 Dixie Estates Way
- LOT 17 Dixie Estates Way
- 282 Orchard Rd
- 232 Orchard Rd
- 475 Orchard Rd
- 474 Orchard Rd
- 000 Orchard Rd
- Tract 1 Tamplen N
- Tract 2 Orchard N
- 00 Orchard Rd
- TBDHy 377 Us Hwy 377
- 21121 Us Highway 377
- TBDHy 377 N Hwy 377
- 20685 Us Highway 377
- 20912 Us Hwy 377 Unit TRAC 2
- 729 Orchard Rd
- TBD Hwy 377 Hwy 377
- 000 Ferguson Rd
- 30 Ferguson Rd
- 398 Highway 377 N
- TBD Us Highway 377 B
- 20614 Us Highway 377