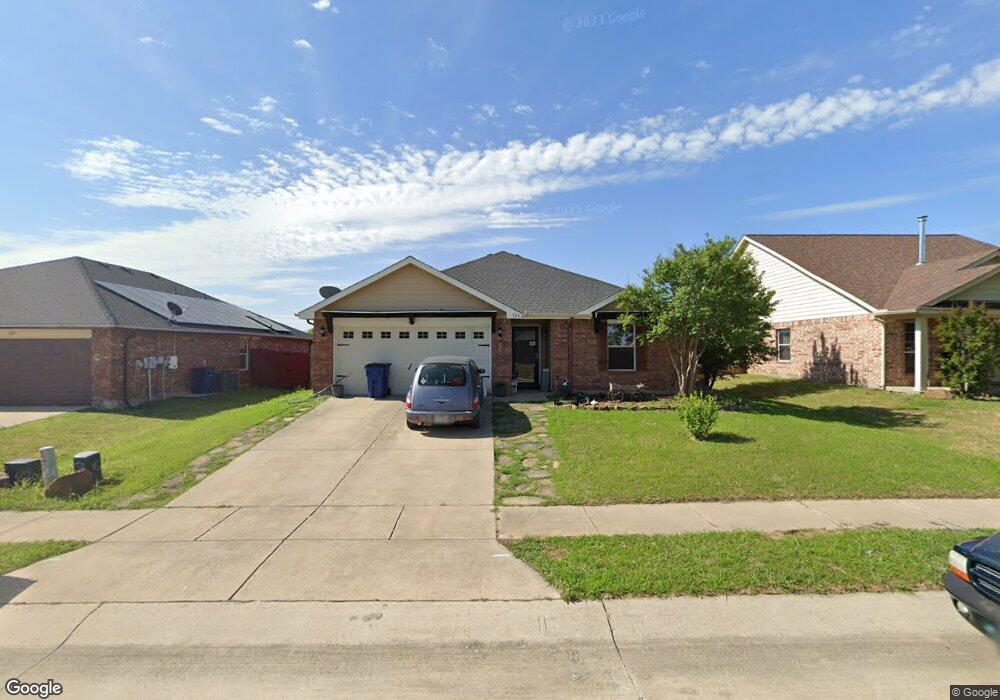
326 Quail Crossing Dr Sanger, TX 76266
Estimated Value: $264,395 - $287,000
3
Beds
2
Baths
1,336
Sq Ft
$205/Sq Ft
Est. Value
About This Home
This home is located at 326 Quail Crossing Dr, Sanger, TX 76266 and is currently estimated at $273,849, approximately $204 per square foot. 326 Quail Crossing Dr is a home located in Denton County with nearby schools including Chisholm Trail Elementary School, Clear Creek Intermediate School, and Sanger Sixth Grade Campus.
Ownership History
Date
Name
Owned For
Owner Type
Purchase Details
Closed on
Feb 10, 2024
Sold by
Bechinger Annemarie
Bought by
Klingele-Bechinger Patrick
Current Estimated Value
Purchase Details
Closed on
Jan 31, 2017
Sold by
Bell Roxanne and Lindberg Roxanne Bell
Bought by
Cronkhite Marije
Home Financials for this Owner
Home Financials are based on the most recent Mortgage that was taken out on this home.
Original Mortgage
$142,500
Interest Rate
4.2%
Mortgage Type
New Conventional
Purchase Details
Closed on
Jul 28, 2005
Sold by
Nuhome Of Texas
Bought by
Bell Roxanne
Home Financials for this Owner
Home Financials are based on the most recent Mortgage that was taken out on this home.
Original Mortgage
$20,158
Interest Rate
5.51%
Mortgage Type
Stand Alone Second
Create a Home Valuation Report for This Property
The Home Valuation Report is an in-depth analysis detailing your home's value as well as a comparison with similar homes in the area
Home Values in the Area
Average Home Value in this Area
Purchase History
| Date | Buyer | Sale Price | Title Company |
|---|---|---|---|
| Klingele-Bechinger Patrick | -- | Chicago Title | |
| Cronkhite Marije | -- | Fatco | |
| Bell Roxanne | -- | -- | |
| Nuhome Of Texas | -- | Nat |
Source: Public Records
Mortgage History
| Date | Status | Borrower | Loan Amount |
|---|---|---|---|
| Previous Owner | Cronkhite Marije | $142,500 | |
| Previous Owner | Nuhome Of Texas | $20,158 | |
| Previous Owner | Bell Roxanne | $80,632 |
Source: Public Records
Tax History Compared to Growth
Tax History
| Year | Tax Paid | Tax Assessment Tax Assessment Total Assessment is a certain percentage of the fair market value that is determined by local assessors to be the total taxable value of land and additions on the property. | Land | Improvement |
|---|---|---|---|---|
| 2025 | $3,930 | $255,152 | $73,425 | $181,727 |
| 2024 | $5,082 | $251,477 | $0 | $0 |
| 2023 | $3,476 | $228,615 | $60,075 | $202,710 |
| 2022 | $4,609 | $207,832 | $60,075 | $157,772 |
| 2021 | $3,971 | $188,938 | $48,394 | $140,544 |
| 2020 | $3,825 | $172,874 | $40,784 | $132,090 |
| 2019 | $3,921 | $172,221 | $40,784 | $131,437 |
| 2018 | $3,746 | $163,673 | $40,784 | $122,889 |
| 2017 | $3,348 | $145,545 | $40,784 | $109,216 |
| 2016 | $3,043 | $132,314 | $40,784 | $104,279 |
| 2014 | -- | $112,502 | $26,819 | $85,683 |
| 2013 | -- | $110,254 | $26,819 | $85,074 |
Source: Public Records
Map
Nearby Homes
- 321 Quail Crossing Dr
- 319 Quail Crossing Dr
- 130 Southside Dr
- 202 Southland Dr
- 2004 S Stemmons St
- 2000 S Stemmons St
- 209 Southland Dr
- 226 Hillcrest St
- 117 Teal Rd
- 114 Pintail Ln
- 124 Morning Glory
- 212 Diane Dr
- 108 Magnolia Dr
- 942 First St
- 936 First St
- 185 Aster Dr
- 113 Diane Dr
- 109 Colonial Heights
- 0000 Rector Rd
- 505 Houston St
- 328 Quail Crossing Dr
- 324 Quail Crossing Dr
- 330 Quail Crossing Dr
- 322 Quail Crossing Dr
- 327 Deer Run Dr
- 325 Deer Run Dr
- 329 Deer Run Dr
- 331 Deer Run Dr
- 320 Quail Crossing Dr
- 329 Quail Crossing Dr
- 325 Quail Crossing Dr
- 334 Quail Crossing Dr
- 333 Quail Crossing Dr
- 323 Quail Crossing Dr
- 321 Deer Run Dr
- 333 Deer Run Dr
- 318 Quail Crossing Dr
- 336 Quail Crossing Dr
- 319 Deer Run Dr
- 335 Quail Crossing Dr