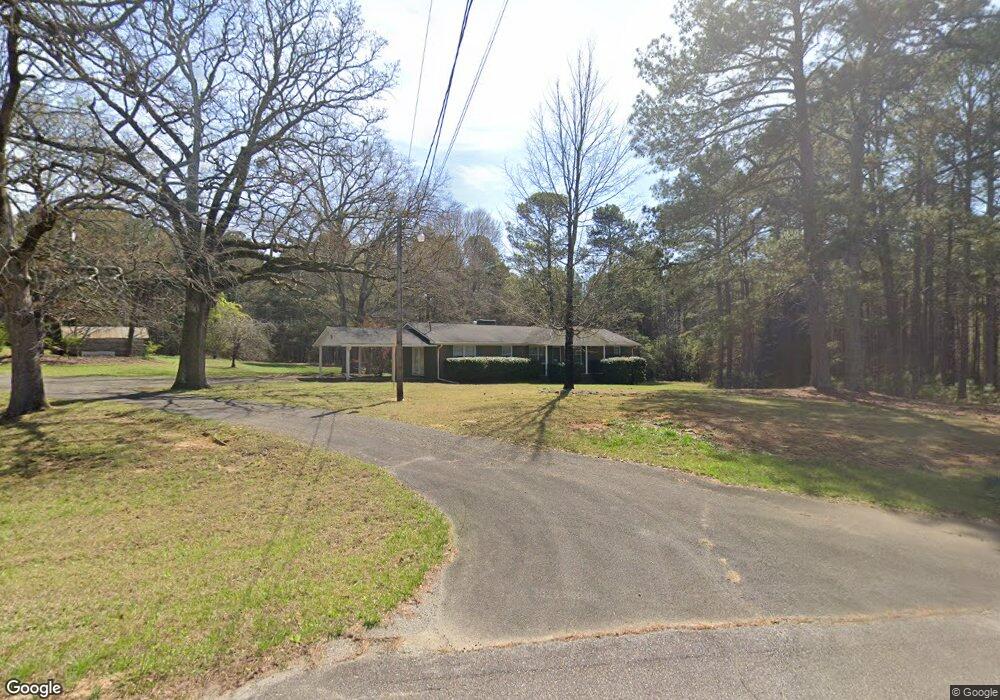
326 Runyon Loop Cedartown, GA 30125
Estimated Value: $275,000 - $383,377
3
Beds
1
Bath
1,710
Sq Ft
$190/Sq Ft
Est. Value
About This Home
This home is located at 326 Runyon Loop, Cedartown, GA 30125 and is currently estimated at $324,792, approximately $189 per square foot. 326 Runyon Loop is a home located in Polk County.
Ownership History
Date
Name
Owned For
Owner Type
Purchase Details
Closed on
Sep 15, 2010
Sold by
Mcadams Cecil O
Bought by
Mcadams Cecil O
Current Estimated Value
Purchase Details
Closed on
Oct 27, 2005
Sold by
Mcadams Doroghy S
Bought by
Mcadams Cecil O
Purchase Details
Closed on
May 10, 1990
Sold by
1St Natl Bk Paulding
Bought by
Mcadams Cecil & Dot
Purchase Details
Closed on
Jan 2, 1990
Sold by
Kinney Charles W
Bought by
1St Natl Bk Paulding
Purchase Details
Closed on
Jan 16, 1989
Sold by
Kinney Susan S
Bought by
Kinney Charles W
Purchase Details
Closed on
Sep 28, 1981
Bought by
Kinney Susan S
Purchase Details
Closed on
Jan 1, 1975
Sold by
Swafford Raymond
Bought by
Kinney Susan S
Purchase Details
Closed on
Dec 29, 1970
Sold by
Swafford Myrtee
Bought by
Swafford Raymond
Purchase Details
Closed on
May 2, 1964
Sold by
Swafford Raymond
Bought by
Swafford Myrtee
Purchase Details
Closed on
Jul 27, 1943
Bought by
Swafford Raymond
Create a Home Valuation Report for This Property
The Home Valuation Report is an in-depth analysis detailing your home's value as well as a comparison with similar homes in the area
Purchase History
| Date | Buyer | Sale Price | Title Company |
|---|---|---|---|
| Mcadams Cecil O | -- | -- | |
| Mcadams Cecil O | -- | -- | |
| Mcadams Cecil O | -- | -- | |
| Mcadams Cecil & Dot | $107,000 | -- | |
| 1St Natl Bk Paulding | $109,400 | -- | |
| Kinney Charles W | -- | -- | |
| Kinney Susan S | -- | -- | |
| Kinney Susan S | -- | -- | |
| Swafford Raymond | -- | -- | |
| Swafford Myrtee | -- | -- | |
| Swafford Raymond | -- | -- |
Source: Public Records
Tax History
| Year | Tax Paid | Tax Assessment Tax Assessment Total Assessment is a certain percentage of the fair market value that is determined by local assessors to be the total taxable value of land and additions on the property. | Land | Improvement |
|---|---|---|---|---|
| 2025 | $3,342 | $148,542 | $69,650 | $78,892 |
| 2024 | $2,336 | $111,763 | $43,531 | $68,232 |
| 2023 | $2,073 | $87,341 | $43,531 | $43,810 |
| 2022 | $1,583 | $66,713 | $29,021 | $37,692 |
| 2021 | $1,604 | $66,713 | $29,021 | $37,692 |
| 2020 | $1,607 | $66,713 | $29,021 | $37,692 |
| 2019 | $1,465 | $54,538 | $29,021 | $25,517 |
| 2018 | $1,480 | $53,726 | $29,021 | $24,705 |
| 2017 | $1,462 | $53,726 | $29,021 | $24,705 |
| 2016 | $1,304 | $47,938 | $23,233 | $24,705 |
| 2015 | $1,315 | $48,170 | $23,233 | $24,937 |
| 2014 | $1,324 | $48,170 | $23,233 | $24,937 |
Source: Public Records
Map
Nearby Homes
- 0 Runyon Loop Unit 10606366
- 0 Runyon Loop Unit 7650113
- 176 Runyon Loop
- 0 Hightower Falls Rd Unit 7746466
- 0 Hightower Falls Rd Unit 7746481
- 0 Hightower Falls Rd Unit 7746485
- 0 Hightower Falls Rd Unit 7746462
- 0 Hightower Falls Rd Unit 7746476
- 0 Hightower Falls Rd Unit 7746451
- 0 Hightower Falls Rd Unit 7745623
- 435 Hampton Rd
- 0 Everett Mtn Rd
- 600 Grady Rd
- 394 Knight Rd
- 247 Grady Rd
- 0 Hightower Rd Unit 10584768
- 0 Hightower Rd Unit 7633002
- 0 Hightower Rd Unit 10584778
- 0 Hightower Rd Unit 7632982
- 1706 Antioch Rd
- 323 Runyon Loop
- 382 Runyon Loop
- 276 Runyon Loop
- 246 Runyon Loop
- 212 Runyon Loop
- 212 Runyon Loop
- 2 Runyon Loop
- 0 Runyon Loop Unit 4 7151281
- 0 Runyon Loop Unit 5 7151282
- 0 Runyon Loop Unit 3 7151248
- 0 Runyon Loop Unit 5 3188672
- 0 Runyon Loop Unit 3 3188670
- 0 Runyon Loop Unit 1 3188658
- 0 Runyon Loop Unit 4 3188671
- 0 Runyon Loop Unit 7073868
- 0 Runyon Loop Unit 1 7150769
- 0 Runyon Loop
- 0 Runyon Loop Unit 7298414
- 571 Runyon Rd
- 222 Runyon Loop
Your Personal Tour Guide
Ask me questions while you tour the home.