Estimated Value: $230,757 - $266,000
3
Beds
2
Baths
1,036
Sq Ft
$233/Sq Ft
Est. Value
About This Home
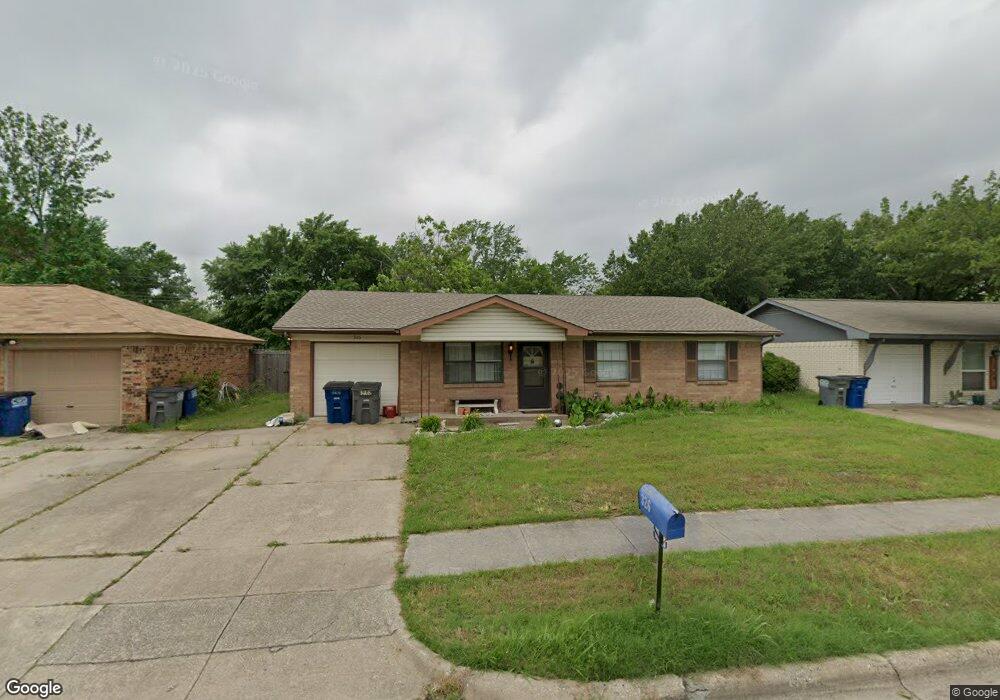
This home is located at 326 S 1st St, Wylie, TX 75098 and is currently estimated at $241,439, approximately $233 per square foot. 326 S 1st St is a home located in Collin County with nearby schools including R F Hartman Elementary School, AB Harrison Intermediate School, and Grady Burnett J High School.
Ownership History
Date
Name
Owned For
Owner Type
Purchase Details
Closed on
Feb 19, 2019
Sold by
Mashigian Lisa R and Rubin Jeanne S
Bought by
Labrys Investments
Current Estimated Value
Home Financials for this Owner
Home Financials are based on the most recent Mortgage that was taken out on this home.
Interest Rate
4.37%
Purchase Details
Closed on
Aug 16, 2011
Sold by
Strous Tracie
Bought by
Mashigian Lisa R and Rubin Jeanne S
Home Financials for this Owner
Home Financials are based on the most recent Mortgage that was taken out on this home.
Original Mortgage
$57,750
Interest Rate
4.65%
Purchase Details
Closed on
Jul 21, 2009
Sold by
Strous Charles
Bought by
Strous Tracie
Purchase Details
Closed on
Feb 22, 2002
Sold by
Sword Edna Elaine and Sword Steve
Bought by
Strous Charles and Strous Tracie
Purchase Details
Closed on
Mar 4, 1999
Sold by
Speir Stephen A
Bought by
Sartain Michael K
Create a Home Valuation Report for This Property
The Home Valuation Report is an in-depth analysis detailing your home's value as well as a comparison with similar homes in the area
Home Values in the Area
Average Home Value in this Area
Purchase History
| Date | Buyer | Sale Price | Title Company |
|---|---|---|---|
| Labrys Investments | -- | -- | |
| Mashigian Lisa R | -- | Ct | |
| Strous Tracie | -- | None Available | |
| Strous Charles | -- | -- | |
| Sartain Michael K | -- | -- | |
| Sartain Michael K | -- | -- |
Source: Public Records
Mortgage History
| Date | Status | Borrower | Loan Amount |
|---|---|---|---|
| Closed | Labrys Investments | -- | |
| Previous Owner | Mashigian Lisa R | $57,750 |
Source: Public Records
Tax History Compared to Growth
Tax History
| Year | Tax Paid | Tax Assessment Tax Assessment Total Assessment is a certain percentage of the fair market value that is determined by local assessors to be the total taxable value of land and additions on the property. | Land | Improvement |
|---|---|---|---|---|
| 2025 | $4,292 | $193,708 | $70,000 | $123,708 |
| 2024 | $4,292 | $217,319 | $70,000 | $147,319 |
| 2023 | $4,292 | $228,000 | $70,000 | $158,000 |
| 2022 | $4,717 | $215,000 | $60,000 | $155,000 |
| 2021 | $3,498 | $148,688 | $55,000 | $93,688 |
| 2020 | $3,054 | $123,000 | $40,000 | $83,000 |
| 2019 | $3,574 | $136,000 | $40,000 | $96,000 |
| 2018 | $3,548 | $131,732 | $40,000 | $91,732 |
| 2017 | $2,793 | $103,700 | $30,000 | $73,700 |
| 2016 | $2,154 | $77,532 | $15,000 | $62,532 |
| 2015 | $1,815 | $71,559 | $15,000 | $56,559 |
Source: Public Records
Map
Nearby Homes
- 329 S 2nd St
- 702 S Ballard Ave
- 416 S 1st St
- 301 S 3rd St
- 327 S 4th St
- 300 Woodhollow Ct
- 306 Woodhollow Ct
- 414 Briarwood Dr
- 416 Dogwood Dr
- 300 S Cottonbelt Ave Unit 3A
- 205 S Cottonbelt Ave
- 804 Memorial Dr
- 104 N 5th St
- 1022 Debby Ct
- 111 N Keefer Dr
- 903 Mardi Gras Ln
- 104 Rushcreek Dr
- 307 Memorial Dr
- 303 N 2nd St
- 217 Cloudcroft Dr