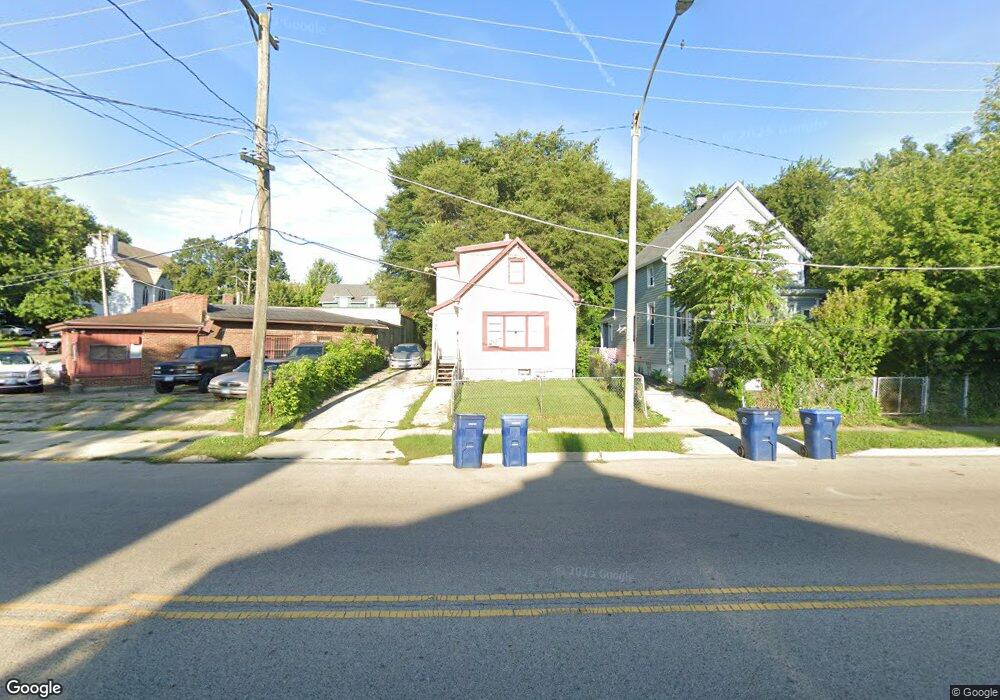
326 S Genesee St Waukegan, IL 60085
Downtown Waukegan NeighborhoodEstimated Value: $139,000 - $159,000
3
Beds
3
Baths
1,107
Sq Ft
$139/Sq Ft
Est. Value
About This Home
This home is located at 326 S Genesee St, Waukegan, IL 60085 and is currently estimated at $153,769, approximately $138 per square foot. 326 S Genesee St is a home located in Lake County with nearby schools including Carman-Buckner Elementary School, John R Lewis Middle School, and Waukegan High School.
Ownership History
Date
Name
Owned For
Owner Type
Purchase Details
Closed on
Jul 28, 2015
Sold by
Bltrejv3 Chicago Llc
Bought by
Csma Blt Llc
Current Estimated Value
Purchase Details
Closed on
Jul 24, 2013
Sold by
Martinez Martha
Bought by
Bltrejv3 Chicago Llc
Purchase Details
Closed on
Aug 16, 2006
Sold by
Martinez Martha
Bought by
Dominguez Fernando and Martinez Martha
Purchase Details
Closed on
Apr 28, 2006
Sold by
Bugarin Leonardo and Buragin Francisca
Bought by
Martinez Martha
Home Financials for this Owner
Home Financials are based on the most recent Mortgage that was taken out on this home.
Original Mortgage
$61,000
Interest Rate
6.56%
Mortgage Type
Fannie Mae Freddie Mac
Purchase Details
Closed on
Jun 9, 1998
Sold by
Montesdeoca Armando and Montesdeoca Annette M
Bought by
Bugarin Leonardo and Bugarin Francisca
Home Financials for this Owner
Home Financials are based on the most recent Mortgage that was taken out on this home.
Original Mortgage
$32,300
Interest Rate
7.32%
Create a Home Valuation Report for This Property
The Home Valuation Report is an in-depth analysis detailing your home's value as well as a comparison with similar homes in the area
Home Values in the Area
Average Home Value in this Area
Purchase History
| Date | Buyer | Sale Price | Title Company |
|---|---|---|---|
| Csma Blt Llc | $14,553,748 | Attorney | |
| Bltrejv3 Chicago Llc | $67,500 | Greater Illinois Title Compa | |
| Dominguez Fernando | -- | None Available | |
| Martinez Martha | $61,000 | First American Title | |
| Bugarin Leonardo | $34,000 | -- |
Source: Public Records
Mortgage History
| Date | Status | Borrower | Loan Amount |
|---|---|---|---|
| Previous Owner | Martinez Martha | $61,000 | |
| Previous Owner | Bugarin Leonardo | $32,300 |
Source: Public Records
Tax History Compared to Growth
Tax History
| Year | Tax Paid | Tax Assessment Tax Assessment Total Assessment is a certain percentage of the fair market value that is determined by local assessors to be the total taxable value of land and additions on the property. | Land | Improvement |
|---|---|---|---|---|
| 2024 | $3,012 | $35,675 | $8,208 | $27,467 |
| 2023 | $2,413 | $31,940 | $7,349 | $24,591 |
| 2022 | $2,413 | $24,679 | $5,433 | $19,246 |
| 2021 | $2,211 | $21,204 | $4,733 | $16,471 |
| 2020 | $2,087 | $18,412 | $4,415 | $13,997 |
| 2019 | $2,101 | $16,872 | $4,046 | $12,826 |
| 2018 | $1,755 | $13,573 | $3,607 | $9,966 |
| 2017 | $1,721 | $12,008 | $3,191 | $8,817 |
| 2016 | $1,796 | $11,623 | $3,962 | $7,661 |
| 2015 | $1,757 | $10,403 | $3,546 | $6,857 |
| 2014 | $999 | $11,444 | $4,531 | $6,913 |
| 2012 | $1,658 | $12,399 | $4,909 | $7,490 |
Source: Public Records
Map
Nearby Homes
- 502 Belvidere Rd
- 547 S Martin Luther King Junior Ave
- 215 S Park Ave
- 613 Clarke Ave
- 557 W Water St
- 305 Besley Place
- 408 Besley Place
- 600 Sunderlin St
- 613 Washington St
- 710 S Martin Luther King Junior Ave
- 515 May St
- 222 Grand Ave
- 446 S Jackson St
- 631 8th St
- 426 Julian St
- 842 Wadsworth Ave
- 815 Prescott St
- 924 Lenox Ave
- 306 Oak Crest St
- 724 10th St