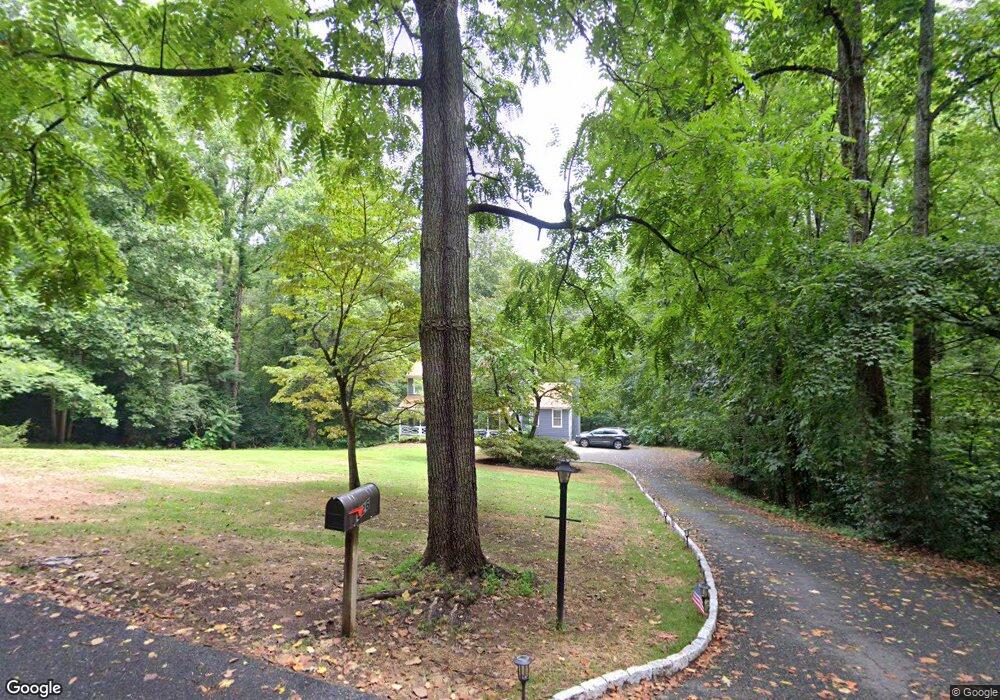
326 Squirrel Path Charlottesville, VA 22901
West Charlottesville NeighborhoodEstimated Value: $715,000 - $765,000
4
Beds
4
Baths
2,356
Sq Ft
$316/Sq Ft
Est. Value
About This Home
This home is located at 326 Squirrel Path, Charlottesville, VA 22901 and is currently estimated at $744,303, approximately $315 per square foot. 326 Squirrel Path is a home located in Albemarle County with nearby schools including Mary Carr Greer Elementary School, Journey Middle School, and Albemarle High School.
Ownership History
Date
Name
Owned For
Owner Type
Purchase Details
Closed on
Sep 30, 2024
Sold by
Rose Emily and Golembiowski John
Bought by
Bubernak Samuel Whitaker
Current Estimated Value
Home Financials for this Owner
Home Financials are based on the most recent Mortgage that was taken out on this home.
Original Mortgage
$300,000
Outstanding Balance
$296,682
Interest Rate
6.08%
Mortgage Type
New Conventional
Estimated Equity
$447,621
Purchase Details
Closed on
Jan 20, 2017
Sold by
Feiner Benjamin and Feiner Emily
Bought by
Golembiowski John and Rose Emily
Home Financials for this Owner
Home Financials are based on the most recent Mortgage that was taken out on this home.
Original Mortgage
$408,500
Interest Rate
4.13%
Mortgage Type
New Conventional
Purchase Details
Closed on
May 6, 2016
Sold by
Commonwealth Of Virginia
Bought by
Feiner Benjamin and Feiner Emily
Home Financials for this Owner
Home Financials are based on the most recent Mortgage that was taken out on this home.
Original Mortgage
$213,600
Interest Rate
3.71%
Mortgage Type
New Conventional
Create a Home Valuation Report for This Property
The Home Valuation Report is an in-depth analysis detailing your home's value as well as a comparison with similar homes in the area
Home Values in the Area
Average Home Value in this Area
Purchase History
| Date | Buyer | Sale Price | Title Company |
|---|---|---|---|
| Bubernak Samuel Whitaker | $752,500 | Stewart Title | |
| Bubernak Samuel Whitaker | $752,500 | Stewart Title | |
| Golembiowski John | $430,000 | Colonial Title | |
| Feiner Benjamin | $267,000 | -- |
Source: Public Records
Mortgage History
| Date | Status | Borrower | Loan Amount |
|---|---|---|---|
| Open | Bubernak Samuel Whitaker | $300,000 | |
| Closed | Bubernak Samuel Whitaker | $300,000 | |
| Previous Owner | Golembiowski John | $408,500 | |
| Previous Owner | Feiner Benjamin | $213,600 |
Source: Public Records
Tax History
| Year | Tax Paid | Tax Assessment Tax Assessment Total Assessment is a certain percentage of the fair market value that is determined by local assessors to be the total taxable value of land and additions on the property. | Land | Improvement |
|---|---|---|---|---|
| 2025 | $6,316 | $706,500 | $137,400 | $569,100 |
| 2024 | $5,175 | $606,000 | $137,400 | $468,600 |
| 2023 | $4,733 | $554,200 | $137,400 | $416,800 |
| 2022 | $4,352 | $509,600 | $137,400 | $372,200 |
| 2021 | $3,996 | $467,900 | $137,400 | $330,500 |
| 2020 | $3,668 | $429,500 | $140,000 | $289,500 |
| 2019 | $3,555 | $416,300 | $140,000 | $276,300 |
| 2018 | $3,152 | $410,300 | $140,000 | $270,300 |
| 2017 | $2,428 | $289,400 | $128,000 | $161,400 |
| 2016 | $2,570 | $306,300 | $128,000 | $178,300 |
| 2015 | $1,275 | $311,400 | $128,000 | $183,400 |
| 2014 | -- | $310,800 | $128,000 | $182,800 |
Source: Public Records
Map
Nearby Homes
- 1594 Cool Spring Rd
- 1614 Garden Ct
- 1552 Garden Ct
- 1583 Birnam Dr
- 28 Woodlake Dr
- 1545 Birnam Dr
- 1702 Webland Park
- 1773 Webland View
- 1518 Birnam Dr
- 439 Wynridge Dr
- 320 Westfield Rd
- 2417 Commonwealth Dr
- 1790 Lambs Rd
- 580 Arrowhead Dr
- 1777 Lambs Rd
- 832 Swede St
- 2752 Hydraulic Rd
- 1045 Glenwood Station Ln
- 143 Green Turtle Ln Unit 3
- 138 Green Turtle Ln Unit 12
- 326 Squirrel Path
- 332 Squirrel Path
- 332 Squirrel Path
- 1871 Pine Cone Cir
- 1877 Pine Cone Cir
- 323 Squirrel Path
- 329 Squirrel Path
- 338 Squirrel Path
- 338 Squirrel Path
- 305 Squirrel Path
- 335 Squirrel Path
- 312 Squirrel Path
- 353 Squirrel Path
- 353 Squirrel Path
- 350 Squirrel Path
- 350 Squirrel Path
- 1883 Pine Cone Cir
- 1880 Pine Cone Cir
- 1889 Pine Cone Cir
- 301 Squirrel Path
Your Personal Tour Guide
Ask me questions while you tour the home.