NOT LISTED FOR SALE

326 Tanglewood Dr Hiram, GA 30141

Estimated Value: $299,295 - $308,000

3 Beds
2 Baths
1,602 Sq Ft
$190/Sq Ft Est. Value

About This Home

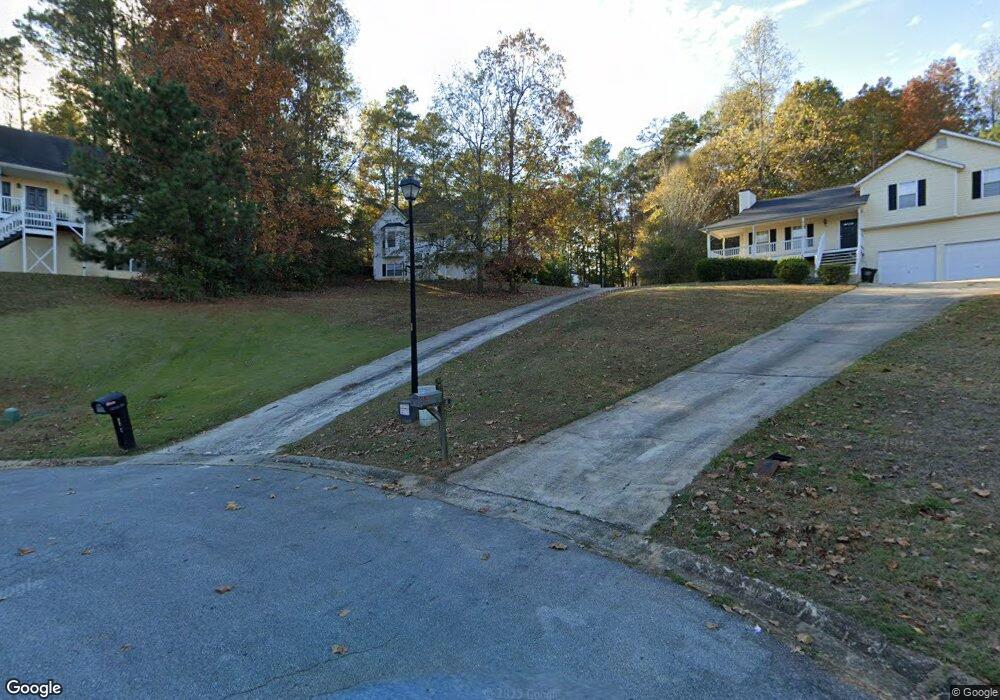
This home is located at 326 Tanglewood Dr, Hiram, GA 30141 and is currently estimated at $303,824, approximately $189 per square foot. 326 Tanglewood Dr is a home located in Paulding County with nearby schools including Sam D. Panter Elementary School, J. A. Dobbins Middle School, and Hiram High School.

Ownership History

Date Name Owned For Owner Type

Purchase Details

Closed on
Dec 24, 1997
Sold by
Brooks Andrew D
Bought by
Brooks Andrew D
Current Estimated Value
$303,824

Home Financials for this Owner

Home Financials are based on the most recent Mortgage that was taken out on this home.
Original Mortgage
$98,620
Interest Rate
7.26%
Mortgage Type
FHA

Purchase Details

Closed on
Dec 23, 1997
Sold by
Tanglewood Homes Inc

Home Financials for this Owner

Home Financials are based on the most recent Mortgage that was taken out on this home.
Original Mortgage
$98,620
Interest Rate
7.26%
Mortgage Type
FHA

Purchase Details

Closed on
Dec 5, 1997
Sold by
Tanglewood Homes
Bought by
Brooks Andrew P and Brooks Ronda

Home Financials for this Owner

Home Financials are based on the most recent Mortgage that was taken out on this home.
Original Mortgage
$98,620
Interest Rate
7.26%
Mortgage Type
FHA

Purchase Details

Closed on
Aug 8, 1997
Sold by
Williams Danny

Range of Values:

Collateral Analytics

Collateral Analytics Collateral Analytics AVMs (Automated Valuation Model) employ a number of statistical approaches combined with neighborhood-specific comparable selection guarantees the most up-to-date and precise valuations.

Not Available

Collateral Analytics does not have data for the current month. Please view the chart for historical values.

ICE

ICE Mortgage Technology ICE Mortgage Technology’s AVM (Automated Valuation Model) is a state-of-the-art online residential property valuation tool that provides a quick and accurate estimate of the value of almost any home in the U.S.

Not Available

ICE Mortgage Technology does not have data for the current month. Please view the chart for historical values.

First American

First American First American Data & Analytics’ next-generation AVM combines unrivaled data assets with a blended ensemble of valuation models to produce highly accurate, reliable valuations you can trust.

Not Available

First American does not have data for the current month. Please view the chart for historical values.

Quantarium

Quantarium Quantarium’s valuation service, repeatedly proven the industry’s most accurate and comprehensive, is supercharged with a self-learning and auto-tuning AI engine that continually becomes smarter and more accurate as it processes daily inputs from the industry’s leading RE data lake.

Not Available

Quantarium does not have data for the current month. Please view the chart for historical values.

Average Value
Not Available
List Price
Sold Price
Create a Home Valuation Report for This Property
The Home Valuation Report is an in-depth analysis detailing your home's value as well as a comparison with similar homes in the area

Home Values in the Area

Source: Public Records

Average Home Value in this Area


Source: Public Records

Purchase History

Date Buyer Sale Price Title Company
Brooks Andrew P $101,000 --
Source: Public Records

Mortgage History

Date Status Borrower Loan Amount
Open Brooks Andrew D $200,000
Closed Brooks Andrew D $25,000
Closed Brooks Andrew D $124,000
Closed Brooks Andrew D $5,791
Closed Brooks Andrew D $115,486
Closed Brooks Andrew P $98,620
Source: Public Records

Tax History Compared to Growth

Source: Public Records

Tax History

Year Tax Paid Tax Assessment Tax Assessment Total Assessment is a certain percentage of the fair market value that is determined by local assessors to be the total taxable value of land and additions on the property. Land Improvement
2024 $2,929 $121,000 $12,000 $109,000
2023 $3,009 $117,960 $12,000 $105,960
2022 $2,701 $105,496 $12,000 $93,496
2021 $2,257 $79,516 $8,000 $71,516
2020 $1,878 $65,088 $8,000 $57,088
2019 $1,838 $62,860 $8,000 $54,860
2016 $1,440 $49,496 $8,000 $41,496
Source: Public Records

Map