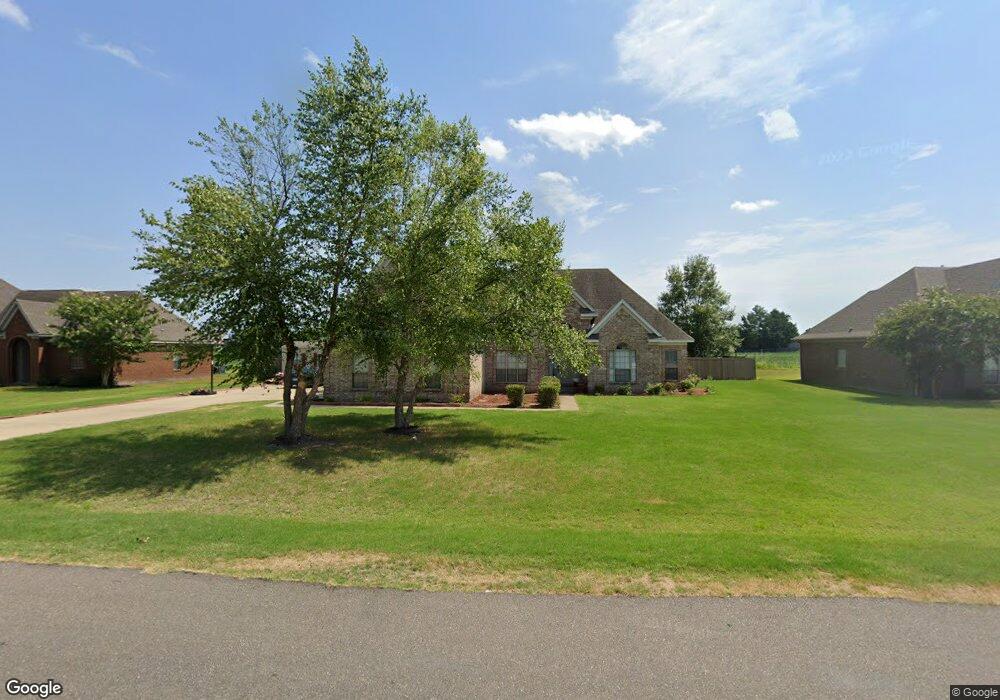
326 Trigg Dr Marion, AR 72364
Estimated Value: $364,184 - $429,000
5
Beds
3
Baths
2,780
Sq Ft
$139/Sq Ft
Est. Value
About This Home
This home is located at 326 Trigg Dr, Marion, AR 72364 and is currently estimated at $387,796, approximately $139 per square foot. 326 Trigg Dr is a home located in Crittenden County with nearby schools including Marion Junior High School, Marion High School, and West Memphis Christian School.
Ownership History
Date
Name
Owned For
Owner Type
Purchase Details
Closed on
Feb 10, 2022
Sold by
Westley Michael John
Bought by
Robinson Jaqua
Current Estimated Value
Home Financials for this Owner
Home Financials are based on the most recent Mortgage that was taken out on this home.
Original Mortgage
$343,561
Interest Rate
3.55%
Mortgage Type
FHA
Purchase Details
Closed on
Jun 3, 2021
Sold by
Nelson Williford Llc
Bought by
Michael John Wesley and Michael Sarah Lindsay
Purchase Details
Closed on
Jun 30, 2015
Sold by
Chumley Bruce L and Chumley Peggy S
Bought by
Michael John Wesley
Home Financials for this Owner
Home Financials are based on the most recent Mortgage that was taken out on this home.
Original Mortgage
$193,325
Interest Rate
3.9%
Mortgage Type
Purchase Money Mortgage
Purchase Details
Closed on
Mar 6, 2007
Sold by
Not Provided
Bought by
Chumley Bruce L and Chumley Peggy S
Create a Home Valuation Report for This Property
The Home Valuation Report is an in-depth analysis detailing your home's value as well as a comparison with similar homes in the area
Purchase History
| Date | Buyer | Sale Price | Title Company |
|---|---|---|---|
| Robinson Jaqua | $349,900 | New Title Company Name | |
| Michael John Wesley | $55,000 | Cowling Title | |
| Michael John Wesley | $199,000 | -- | |
| Chumley Bruce L | $203,000 | -- |
Source: Public Records
Mortgage History
| Date | Status | Borrower | Loan Amount |
|---|---|---|---|
| Closed | Robinson Jaqua | $343,561 | |
| Previous Owner | Michael John Wesley | $193,325 |
Source: Public Records
Tax History
| Year | Tax Paid | Tax Assessment Tax Assessment Total Assessment is a certain percentage of the fair market value that is determined by local assessors to be the total taxable value of land and additions on the property. | Land | Improvement |
|---|---|---|---|---|
| 2025 | $3,097 | $70,106 | $7,600 | $62,506 |
| 2024 | $2,816 | $47,940 | $7,600 | $40,340 |
| 2023 | $2,391 | $47,940 | $7,600 | $40,340 |
| 2022 | $2,441 | $47,940 | $7,600 | $40,340 |
| 2021 | $2,816 | $47,940 | $7,600 | $40,340 |
| 2020 | $2,669 | $47,940 | $7,600 | $40,340 |
| 2019 | $2,168 | $42,420 | $6,800 | $35,620 |
| 2018 | $2,281 | $42,420 | $6,800 | $35,620 |
| 2017 | $2,281 | $42,420 | $6,800 | $35,620 |
| 2016 | $2,281 | $0 | $0 | $0 |
| 2015 | $1,948 | $42,420 | $6,800 | $35,620 |
| 2014 | $1,977 | $42,970 | $6,800 | $36,170 |
Source: Public Records
Map
Nearby Homes
- 501 Rivertrace Cove
- 524 Apperson Cove
- 304 Trigg Dr
- 102 Brandywine Cove
- 417 Danner Dr
- 502 Apperson Dr
- 346 Rita Rd
- Lot 2 Marion Lake Rd
- 694 Riverwest Cir
- 84 Willow Dr
- 117 Sycamore Dr
- 0 Marion Lake Rd
- 2011 State Highway 77
- 612 N East Lake Dr
- 614 N East Lake Dr N
- 1901 State Highway 77
- 16 Cypress Dr
- 213 Candy Cove
- 169 Cypress Ave
- 123 Cedar Ave
- 328 Trigg Dr
- 324 Trigg Dr
- 325 Trigg Dr
- 327 Trigg Dr
- 330 Trigg Dr
- 322 Trigg Dr
- 0 Trigg Dr
- 323 Trigg Dr
- 329 Trigg Dr
- 407 Charleston Cove
- 332 Trigg Dr
- 409 Charleston Cove
- 55 Mckenzie Cove
- 320 Trigg Dr
- 400 Maywood Cove
- 56 Mckenzie Cove
- 400 Charleston Cove
- 53 Mckenzie Cove
- 402 Maywood Cove
- 404 Charleston Cove
Your Personal Tour Guide
Ask me questions while you tour the home.