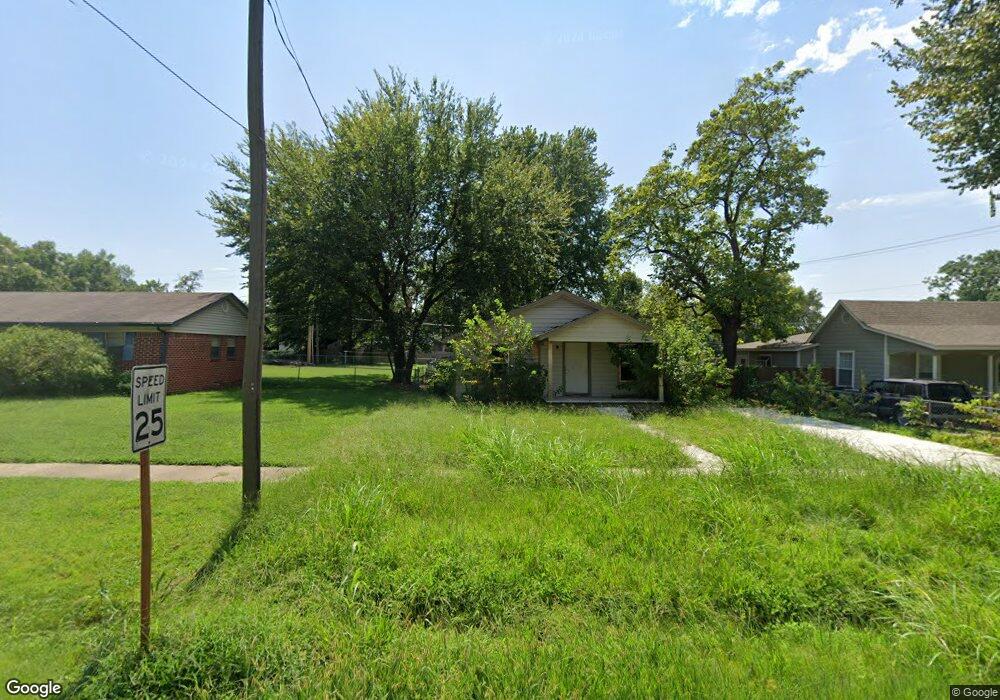
326 W Chestnut St Coweta, OK 74429
Estimated Value: $61,000 - $124,419
3
Beds
1
Bath
1,008
Sq Ft
$93/Sq Ft
Est. Value
About This Home
This home is located at 326 W Chestnut St, Coweta, OK 74429 and is currently estimated at $93,605, approximately $92 per square foot. 326 W Chestnut St is a home located in Wagoner County with nearby schools including Donald P. Sloat Junior High School, Coweta Intermediate High School, and Coweta High School.
Ownership History
Date
Name
Owned For
Owner Type
Purchase Details
Closed on
Mar 20, 2023
Sold by
Angel Oak Investmetns Llc
Bought by
Boundless Capital Llc
Current Estimated Value
Home Financials for this Owner
Home Financials are based on the most recent Mortgage that was taken out on this home.
Original Mortgage
$109,900
Interest Rate
6.33%
Mortgage Type
Construction
Purchase Details
Closed on
Feb 13, 2023
Sold by
Abundant Life Properties Llc
Bought by
Angel Oak Investments Llc
Home Financials for this Owner
Home Financials are based on the most recent Mortgage that was taken out on this home.
Original Mortgage
$109,900
Interest Rate
6.33%
Mortgage Type
Construction
Purchase Details
Closed on
Jun 29, 2022
Sold by
Easley Bonnie M
Bought by
Abundant Life Properties Llc
Purchase Details
Closed on
Jun 7, 1994
Sold by
Sanders Ralph
Bought by
Easley Bonnie M
Create a Home Valuation Report for This Property
The Home Valuation Report is an in-depth analysis detailing your home's value as well as a comparison with similar homes in the area
Home Values in the Area
Average Home Value in this Area
Purchase History
| Date | Buyer | Sale Price | Title Company |
|---|---|---|---|
| Boundless Capital Llc | $55,000 | -- | |
| Angel Oak Investments Llc | $45,000 | Fidelity National Title | |
| Abundant Life Properties Llc | $28,000 | None Listed On Document | |
| Easley Bonnie M | -- | -- |
Source: Public Records
Mortgage History
| Date | Status | Borrower | Loan Amount |
|---|---|---|---|
| Closed | Angel Oak Investments Llc | $109,900 |
Source: Public Records
Tax History Compared to Growth
Tax History
| Year | Tax Paid | Tax Assessment Tax Assessment Total Assessment is a certain percentage of the fair market value that is determined by local assessors to be the total taxable value of land and additions on the property. | Land | Improvement |
|---|---|---|---|---|
| 2025 | $563 | $6,250 | $1,646 | $4,604 |
| 2024 | $563 | $5,952 | $1,646 | $4,306 |
| 2023 | $1,020 | $10,785 | $1,646 | $9,139 |
| 2022 | $398 | $4,242 | $722 | $3,520 |
| 2021 | $387 | $4,040 | $685 | $3,355 |
| 2020 | $358 | $3,847 | $656 | $3,191 |
| 2019 | $347 | $3,664 | $617 | $3,047 |
| 2018 | $337 | $3,489 | $585 | $2,904 |
| 2017 | $315 | $3,324 | $578 | $2,746 |
| 2016 | $301 | $3,166 | $572 | $2,594 |
| 2015 | -- | $3,015 | $566 | $2,449 |
| 2014 | -- | $2,871 | $560 | $2,311 |
Source: Public Records
Map
Nearby Homes
- 208 N Division St
- 105 S Old Main St
- 317 W Pine St
- 213 W Pine St
- 329 W Oak St
- 226 S Old Main St
- 500 N Division St
- 512 N Division St
- 508 N Division St
- 420 N Division St
- 616 N Division St
- 311 W Ash St
- 125 W Walnut St
- 504 S Division St
- 210 E Chestnut St
- 222 E Pecan St
- 321 S Delaware Ave Unit E
- 514 S Broadway
- 403 S Delaware Ave
- 0 E 146th St S Unit 2536498
- 332 W Chestnut St
- 320 W Chestnut St
- 113 N Division St
- 325 W Sycamore St
- 314 W Chestnut St
- 124 N Division St
- 107 N Division St
- 319 W Sycamore St
- 315 W Sycamore St
- 329 W Chestnut St
- 310 W Chestnut St
- 333 W Chestnut St
- 116 N Division St
- 325 W Chestnut St
- 120 N Division St
- 321 W Chestnut St
- 317 W Chestnut St
- 202 N Division St
- 311 W Chestnut St
- 120 N Atoka Ave