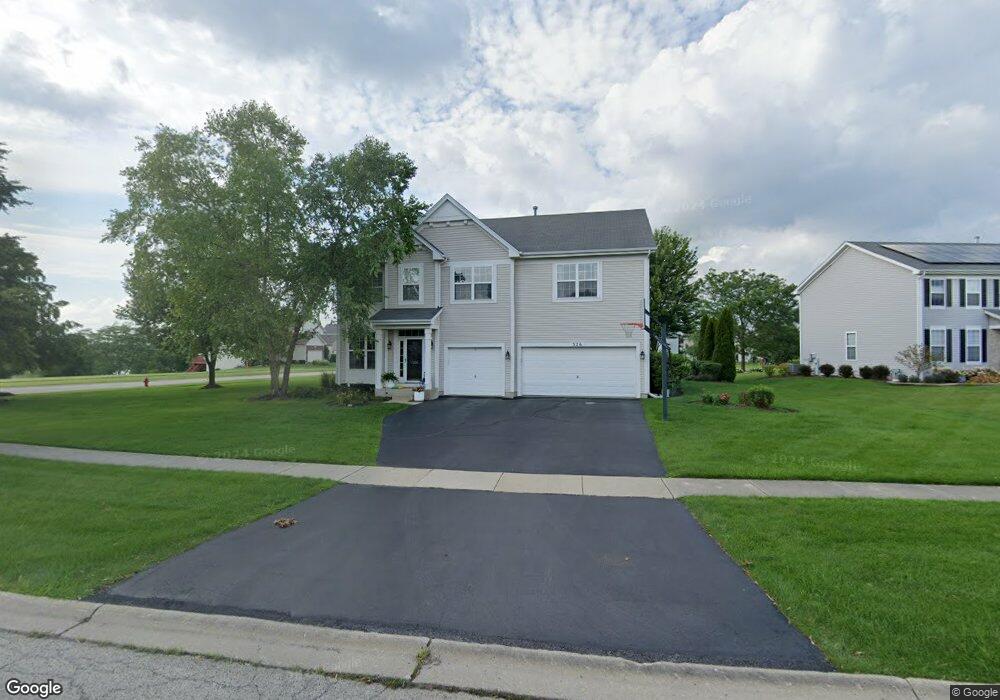
326 W Olmsted Ln Unit 4 Round Lake, IL 60073
Estimated Value: $462,000 - $478,000
4
Beds
3
Baths
3,415
Sq Ft
$139/Sq Ft
Est. Value
About This Home
This home is located at 326 W Olmsted Ln Unit 4, Round Lake, IL 60073 and is currently estimated at $473,489, approximately $138 per square foot. 326 W Olmsted Ln Unit 4 is a home located in Lake County with nearby schools including Fremont Elementary School, Fremont Intermediate School, and Fremont Jr High/Middle School.
Ownership History
Date
Name
Owned For
Owner Type
Purchase Details
Closed on
Jan 31, 2022
Sold by
Olorvida Albert A and Olorvida Jennifer R
Bought by
Albert Olorvida Living Trust and Jennifer R Olorvida
Current Estimated Value
Purchase Details
Closed on
Oct 9, 2017
Sold by
Olorvida Albert A and Olorvida Jennifer R
Bought by
Olorvida Albert A and Olorvida Jennifer R
Purchase Details
Closed on
Dec 14, 2004
Sold by
Lakewood Grove Llc
Bought by
Olorvida Albert A and Olorvida Jennifer R
Home Financials for this Owner
Home Financials are based on the most recent Mortgage that was taken out on this home.
Original Mortgage
$330,000
Interest Rate
6.12%
Mortgage Type
Unknown
Create a Home Valuation Report for This Property
The Home Valuation Report is an in-depth analysis detailing your home's value as well as a comparison with similar homes in the area
Home Values in the Area
Average Home Value in this Area
Purchase History
| Date | Buyer | Sale Price | Title Company |
|---|---|---|---|
| Albert Olorvida Living Trust | -- | Ziccardi Law Offices | |
| Olorvida Albert A | -- | None Available | |
| Olorvida Albert A | $373,500 | -- |
Source: Public Records
Mortgage History
| Date | Status | Borrower | Loan Amount |
|---|---|---|---|
| Previous Owner | Olorvida Albert A | $330,000 |
Source: Public Records
Tax History Compared to Growth
Tax History
| Year | Tax Paid | Tax Assessment Tax Assessment Total Assessment is a certain percentage of the fair market value that is determined by local assessors to be the total taxable value of land and additions on the property. | Land | Improvement |
|---|---|---|---|---|
| 2024 | $12,858 | $125,705 | $28,060 | $97,645 |
| 2023 | $12,498 | $115,178 | $25,710 | $89,468 |
| 2022 | $12,498 | $108,678 | $25,329 | $83,349 |
| 2021 | $11,646 | $100,662 | $24,468 | $76,194 |
| 2020 | $11,595 | $97,892 | $23,795 | $74,097 |
| 2019 | $11,290 | $94,674 | $23,013 | $71,661 |
| 2018 | $9,943 | $82,460 | $20,215 | $62,245 |
| 2017 | $9,866 | $79,865 | $19,579 | $60,286 |
| 2016 | $9,821 | $75,852 | $18,595 | $57,257 |
| 2015 | $7,457 | $71,109 | $17,432 | $53,677 |
| 2014 | $6,717 | $65,677 | $16,815 | $48,862 |
| 2012 | $6,779 | $66,260 | $16,964 | $49,296 |
Source: Public Records
Map
Nearby Homes
- 247 W Olmsted Ln
- 530 W Kristina Ln Unit 3904
- 1851 S Hamlin Ln Unit 2
- 2043 S Kristina Ln Unit 3
- 261 Rodeo Dr
- 642 W Kristina Ln Unit 3
- 0 W Chardon Rd
- 645 W Jonathan Dr Unit 3
- 1823 S Fallbrook Dr
- 663 W Jonathan Dr
- 2054 S Jonathan Dr
- 115 Hunter Ct
- 305 Legacy Ct
- 18 Rocking Horse Ln Unit 2298
- 103 Jockey Ct Unit 2014
- 1 Rocking Horse Ln
- 593 W Hamlin Ln Unit 1
- 389 W Caldwell Dr
- 9 Derby Ct
- 3 Furlong Ct
- 306 W Olmsted Ln
- 2229 S Arden Ln Unit 4
- 294 W Olmsted Ln
- 2232 S Arden Ln Unit 4
- 2227 S Arden Ln Unit 4
- 2275 S Arden Ln
- 2230 S Arden Ln Unit 4
- 2219 S Arden Ln Unit 4
- 2219 S Arden Ln Unit 2219
- 282 W Olmsted Ln
- 297 W Olmsted Ln
- 2214 S Arden Ln Unit 4
- 2217 S Arden Ln
- 2217 S Arden Ln Unit 1
- 2291 S Arden Ln
- 285 W Olmsted Ln
- 2212 S Arden Ln Unit 4
- 270 W Olmsted Ln
- 2270 S Arden Ln
- 285 W Norwell Ln Unit 4