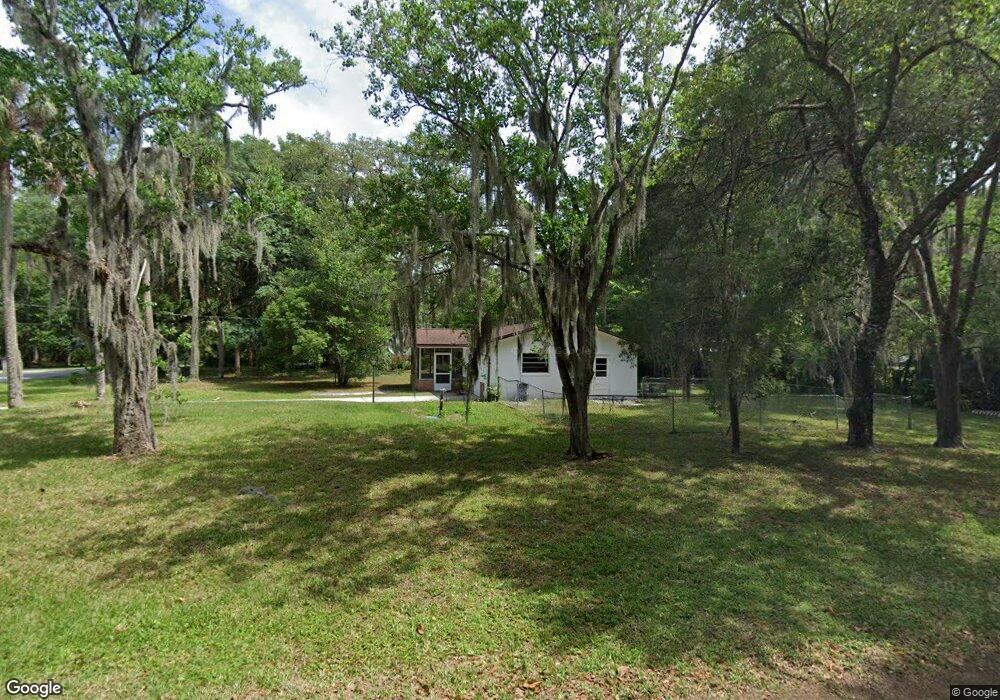
3260 S Michigan Blvd Homosassa, FL 34448
Estimated Value: $163,000 - $226,000
2
Beds
1
Bath
1,144
Sq Ft
$168/Sq Ft
Est. Value
About This Home
This home is located at 3260 S Michigan Blvd, Homosassa, FL 34448 and is currently estimated at $192,506, approximately $168 per square foot. 3260 S Michigan Blvd is a home located in Citrus County with nearby schools including Homosassa Elementary School, Crystal River High School, and Crystal River Middle School.
Ownership History
Date
Name
Owned For
Owner Type
Purchase Details
Closed on
Jun 10, 2021
Sold by
Young Doris Aileen and Young Marshall L
Bought by
Young Doris Aileen and The Young Family Revocable Liv
Current Estimated Value
Purchase Details
Closed on
May 11, 2010
Sold by
Federal Home Loan Mortgage Corporation
Bought by
Young Marshall L and Young Doris Aileen
Purchase Details
Closed on
Mar 25, 2010
Sold by
Bank Of America Na
Bought by
Federal Home Loan Mortgage Corp
Purchase Details
Closed on
Mar 1, 2010
Bought by
Young Doris Aileen
Purchase Details
Closed on
Dec 17, 2009
Sold by
Coffman Steven R and Coffman Melva Lou
Bought by
Bank Of America Na
Purchase Details
Closed on
Dec 1, 2009
Bought by
Young Doris Aileen
Purchase Details
Closed on
Jun 1, 1999
Bought by
Young Doris Aileen
Purchase Details
Closed on
Oct 1, 1998
Bought by
Young Doris Aileen
Purchase Details
Closed on
Mar 1, 1988
Bought by
Young Doris Aileen
Create a Home Valuation Report for This Property
The Home Valuation Report is an in-depth analysis detailing your home's value as well as a comparison with similar homes in the area
Home Values in the Area
Average Home Value in this Area
Purchase History
| Date | Buyer | Sale Price | Title Company |
|---|---|---|---|
| Young Doris Aileen | -- | Attorney | |
| Young Marshall L | $33,500 | Attorney | |
| Federal Home Loan Mortgage Corp | -- | Attorney | |
| Young Doris Aileen | $100 | -- | |
| Bank Of America Na | -- | Attorney | |
| Bank Of America Na | -- | None Available | |
| Young Doris Aileen | $100 | -- | |
| Young Doris Aileen | $55,000 | -- | |
| Young Doris Aileen | $47,400 | -- | |
| Young Doris Aileen | $35,000 | -- |
Source: Public Records
Tax History Compared to Growth
Tax History
| Year | Tax Paid | Tax Assessment Tax Assessment Total Assessment is a certain percentage of the fair market value that is determined by local assessors to be the total taxable value of land and additions on the property. | Land | Improvement |
|---|---|---|---|---|
| 2024 | $1,700 | $130,726 | $16,000 | $114,726 |
| 2023 | $1,700 | $126,420 | $11,420 | $115,000 |
| 2022 | $1,477 | $106,121 | $4,600 | $101,521 |
| 2021 | $1,275 | $82,378 | $4,540 | $77,838 |
| 2020 | $1,122 | $73,388 | $4,540 | $68,848 |
| 2019 | $1,047 | $67,474 | $4,540 | $62,934 |
| 2018 | $930 | $57,276 | $4,540 | $52,736 |
| 2017 | $873 | $52,227 | $4,540 | $47,687 |
| 2016 | $799 | $43,299 | $4,540 | $38,759 |
| 2015 | $706 | $36,400 | $4,530 | $31,870 |
| 2014 | $791 | $39,930 | $4,786 | $35,144 |
Source: Public Records
Map
Nearby Homes
- 3409 S Suncoast Blvd
- 3404 S Michigan Blvd
- 8107 W Mayfair Dr
- 3411 S Michigan Blvd
- 8374 W Mayfair Dr
- 8275 W Windhaven Place
- 8118 W Windhaven Place
- 8178 W Windhaven Place
- 8696 W Faust Ln
- 3386 S Indiana Ave
- 8733 W Elkhorn Dr
- 8145 W Fern Place
- 8090 & 8112 W Mistflower Place
- 8030 W Hawthorne Place
- 3919 S Illinois Terrace
- 8048 W Fern Place
- 3740 S Eastpark Way
- 7941 W Ox Eye Place
- 3834 S Centennial Ave
- 7947 W Luxemburg Ln
- 3280 S Michigan Blvd
- 3291 S Canadian Way
- 8465 W Ivy Place
- 3257 S Canadian Way
- 3249 S Michigan Blvd
- 3224 S Michigan Blvd
- 3290 S Michigan Blvd
- 3259 S Michigan Blvd
- 3290 S Canadian Way
- 3209 S Michigan Blvd
- 3209 S Michigan Blvd
- 3328 S Canadian Way
- 3208 S Detroit Way
- 3241 S Canadian Way
- 3352 S Canadian Way
- 3320 S Michigan Blvd
- 3305 S Michigan Blvd
- 3190 S Michigan Blvd
- 3366 S Canadian Way
- 3171 S Michigan Blvd