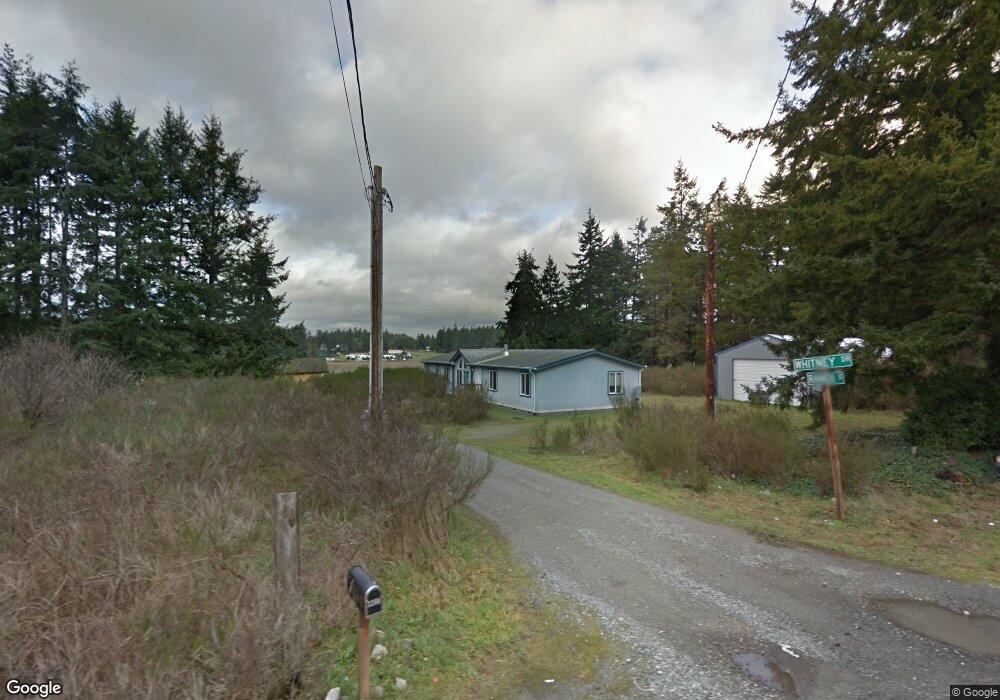
3260 Whitney Dr Oak Harbor, WA 98277
Estimated Value: $655,000 - $742,179
3
Beds
2
Baths
2,228
Sq Ft
$317/Sq Ft
Est. Value
About This Home
This home is located at 3260 Whitney Dr, Oak Harbor, WA 98277 and is currently estimated at $706,295, approximately $317 per square foot. 3260 Whitney Dr is a home located in Island County with nearby schools including Crescent Harbor Elementary School, North Whidbey Middle School, and Oak Harbor High School.
Ownership History
Date
Name
Owned For
Owner Type
Purchase Details
Closed on
Mar 29, 2021
Sold by
Breckenridge Property Fund 2016 Llc
Bought by
Carpenter Jennifer and Carpenter Brian
Current Estimated Value
Home Financials for this Owner
Home Financials are based on the most recent Mortgage that was taken out on this home.
Original Mortgage
$480,000
Interest Rate
3.1%
Mortgage Type
New Conventional
Purchase Details
Closed on
Nov 10, 2020
Sold by
Irvin Scott and Irvin Rachel K
Bought by
Property Fund 2016 Llc
Purchase Details
Closed on
Jul 25, 2019
Sold by
Irvin Scott and Irvin Rachel K
Bought by
Breckenridge Proeprty Fund 2016 Llc
Purchase Details
Closed on
Feb 21, 2006
Sold by
Swartwood Family Lp
Bought by
Irvin Scott and Irvin Rachel K
Home Financials for this Owner
Home Financials are based on the most recent Mortgage that was taken out on this home.
Original Mortgage
$290,000
Interest Rate
6.12%
Mortgage Type
Construction
Create a Home Valuation Report for This Property
The Home Valuation Report is an in-depth analysis detailing your home's value as well as a comparison with similar homes in the area
Home Values in the Area
Average Home Value in this Area
Purchase History
| Date | Buyer | Sale Price | Title Company |
|---|---|---|---|
| Carpenter Jennifer | $600,000 | Ctc | |
| Property Fund 2016 Llc | -- | None Available | |
| Breckenridge Proeprty Fund 2016 Llc | $243,633 | None Available | |
| Irvin Scott | $92,500 | Chicago Title Co Island Div |
Source: Public Records
Mortgage History
| Date | Status | Borrower | Loan Amount |
|---|---|---|---|
| Previous Owner | Carpenter Jennifer | $480,000 | |
| Previous Owner | Irvin Scott | $290,000 |
Source: Public Records
Tax History Compared to Growth
Tax History
| Year | Tax Paid | Tax Assessment Tax Assessment Total Assessment is a certain percentage of the fair market value that is determined by local assessors to be the total taxable value of land and additions on the property. | Land | Improvement |
|---|---|---|---|---|
| 2025 | $4,612 | $666,238 | $300,000 | $366,238 |
| 2024 | $4,546 | $650,436 | $280,000 | $370,436 |
| 2023 | $4,546 | $644,634 | $270,000 | $374,634 |
| 2022 | $4,612 | $582,081 | $240,000 | $342,081 |
| 2021 | $4,294 | $444,934 | $175,000 | $269,934 |
| 2020 | $4,003 | $413,350 | $150,000 | $263,350 |
| 2019 | $3,532 | $388,111 | $185,000 | $203,111 |
| 2018 | $3,792 | $373,687 | $170,000 | $203,687 |
| 2017 | $3,450 | $354,838 | $150,000 | $204,838 |
| 2016 | $3,750 | $344,946 | $140,000 | $204,946 |
| 2015 | -- | $362,224 | $155,000 | $207,224 |
| 2013 | -- | $344,040 | $132,264 | $211,776 |
Source: Public Records
Map
Nearby Homes
- 238 W Green Valley Rd
- 140 W Green Valley Rd
- 3167 Hunt Rd
- 222 Moonstone Place
- 2995 Hunt Rd
- 900 NE 24th Ln
- 201 Sunset Dr
- 951 NE 21st Ct Unit 3
- 0 XXX Goldie Rd Unit 2
- 0 NHN Goldie Rd
- 288 Torrence Ln
- 0 XXX NE 16th Ave
- 0 W Frostad Rd
- 1864 NE 11th Ave
- 3100 Taylor Rd Unit 1-5
- 2725 Hunt Rd
- 1641 NE 11th Ave
- 544 Easy St
- 159 E Crescent Harbor Rd
- 496 Secluded Ln
- 3252 Whitney Dr
- 3244 Whitney Dr
- 3238 Whitney Dr
- 3237 Whitney Dr
- 223 W Ranken St
- 3238 Lange St
- 3228 Whitney Dr
- 3229 Whitney Dr
- 3222 Whitney Dr
- 164 W Green Valley Rd
- 3241 Lange St
- 34642 Sr20
- 34642 State Route 20
- 3220 Whitney Dr
- 3231 Lange St
- 3217 Whitney Dr
- 3218 Whitney Dr
- 3240 State St Unit 1 2
- 3240 State St