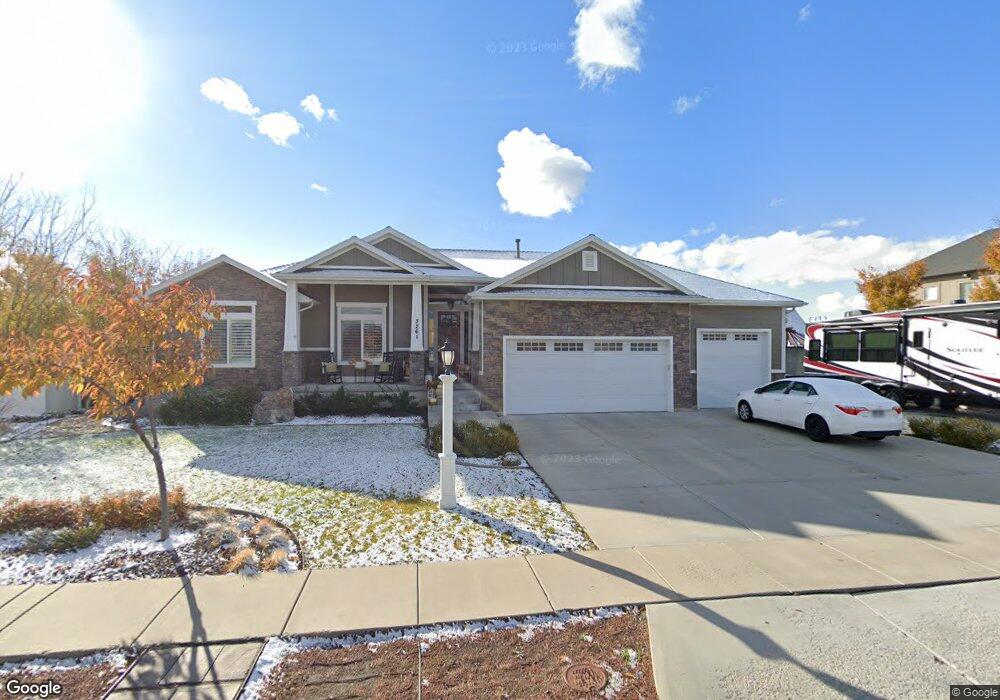
3261 W 275 N Unit 203 Layton, UT 84041
Estimated Value: $671,000 - $730,000
4
Beds
3
Baths
1,956
Sq Ft
$356/Sq Ft
Est. Value
About This Home
This home is located at 3261 W 275 N Unit 203, Layton, UT 84041 and is currently estimated at $696,497, approximately $356 per square foot. 3261 W 275 N Unit 203 is a home located in Davis County with nearby schools including Sand Springs Elementary School, Legacy Junior High School, and Layton High School.
Ownership History
Date
Name
Owned For
Owner Type
Purchase Details
Closed on
Dec 22, 2020
Sold by
Leishman Eric L and Leishman Tammy H
Bought by
Leishman Eric L and Leishman Tamra H
Current Estimated Value
Home Financials for this Owner
Home Financials are based on the most recent Mortgage that was taken out on this home.
Original Mortgage
$249,000
Outstanding Balance
$222,080
Interest Rate
2.8%
Mortgage Type
New Conventional
Estimated Equity
$474,417
Purchase Details
Closed on
Dec 21, 2012
Sold by
Brighton Bank
Bought by
Leishman Eric L and Leishman Tammy H
Home Financials for this Owner
Home Financials are based on the most recent Mortgage that was taken out on this home.
Original Mortgage
$253,200
Interest Rate
3.27%
Mortgage Type
Construction
Purchase Details
Closed on
Jun 28, 2012
Sold by
Benchmark Real Estate Company
Bought by
Brighton Bank
Create a Home Valuation Report for This Property
The Home Valuation Report is an in-depth analysis detailing your home's value as well as a comparison with similar homes in the area
Home Values in the Area
Average Home Value in this Area
Purchase History
| Date | Buyer | Sale Price | Title Company |
|---|---|---|---|
| Leishman Eric L | -- | Us Title Company Of Utah | |
| Leishman Eric L | -- | Founders Title Company | |
| Brighton Bank | -- | Founders Title Co L |
Source: Public Records
Mortgage History
| Date | Status | Borrower | Loan Amount |
|---|---|---|---|
| Open | Leishman Eric L | $249,000 | |
| Closed | Leishman Eric L | $253,200 |
Source: Public Records
Tax History Compared to Growth
Tax History
| Year | Tax Paid | Tax Assessment Tax Assessment Total Assessment is a certain percentage of the fair market value that is determined by local assessors to be the total taxable value of land and additions on the property. | Land | Improvement |
|---|---|---|---|---|
| 2025 | $3,479 | $365,200 | $130,666 | $234,534 |
| 2024 | $3,365 | $355,850 | $140,162 | $215,688 |
| 2023 | $3,498 | $652,000 | $147,594 | $504,406 |
| 2022 | $3,755 | $380,051 | $86,312 | $293,739 |
| 2021 | $3,511 | $530,000 | $129,451 | $400,549 |
| 2020 | $3,176 | $460,000 | $110,490 | $349,510 |
| 2019 | $3,130 | $444,000 | $109,514 | $334,486 |
| 2018 | $2,900 | $413,000 | $96,474 | $316,526 |
| 2016 | $2,633 | $193,380 | $39,883 | $153,497 |
| 2015 | $2,247 | $156,695 | $39,883 | $116,812 |
| 2014 | $2,319 | $165,318 | $39,883 | $125,435 |
| 2013 | -- | $73,416 | $73,416 | $0 |
Source: Public Records
Map
Nearby Homes