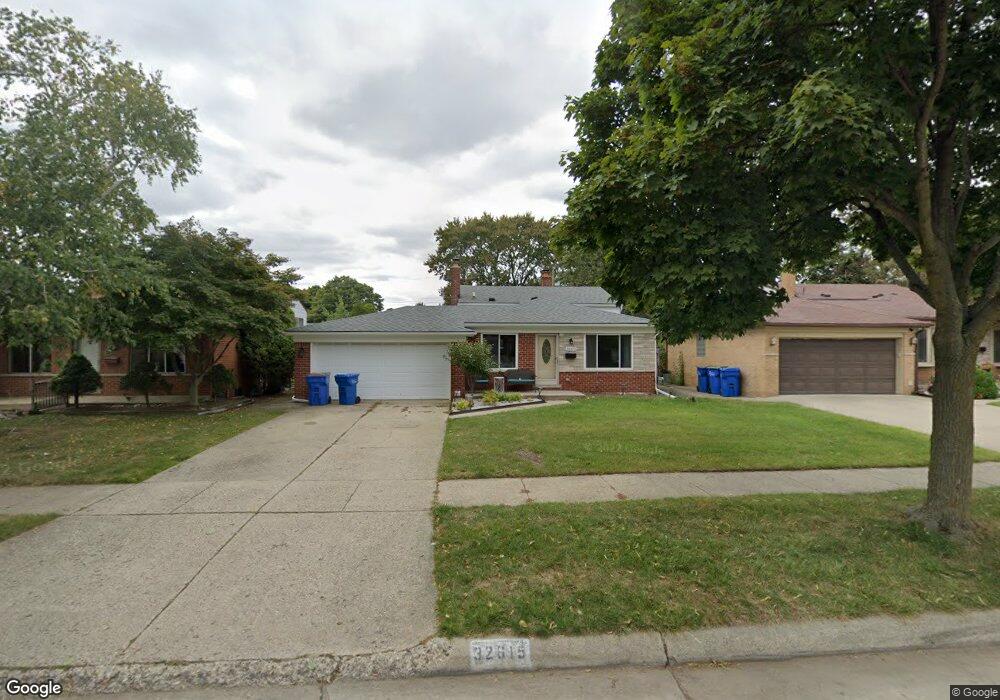
32615 Beechwood Dr Warren, MI 48088
Northeast Warren NeighborhoodEstimated Value: $231,340 - $284,000
Studio
1
Bath
1,570
Sq Ft
$167/Sq Ft
Est. Value
About This Home
This home is located at 32615 Beechwood Dr, Warren, MI 48088 and is currently estimated at $262,085, approximately $166 per square foot. 32615 Beechwood Dr is a home located in Macomb County with nearby schools including Wilde Elementary School, Carter Middle School, and Paul K. Cousino High School.
Ownership History
Date
Name
Owned For
Owner Type
Purchase Details
Closed on
Jul 11, 2019
Sold by
Demopolis Antonette
Bought by
Aemopolis Frances
Current Estimated Value
Purchase Details
Closed on
Dec 19, 2018
Sold by
Michael Demopolis Frances and Michael Momicilovic
Bought by
Momcilovic Michael and Demopolis Antoinette
Purchase Details
Closed on
Apr 11, 2016
Sold by
Demopolis Frnces
Bought by
Demopolis Frances and Momcilovic Michael
Purchase Details
Closed on
Dec 13, 2012
Sold by
Demopolis Frances and Momcilovic Michael W
Bought by
Demopolis Frances
Purchase Details
Closed on
Mar 31, 2006
Sold by
Demopolis Frances
Bought by
Demopolis Frances and Momcilovic Michael W
Home Financials for this Owner
Home Financials are based on the most recent Mortgage that was taken out on this home.
Original Mortgage
$154,800
Interest Rate
6.34%
Mortgage Type
Stand Alone Refi Refinance Of Original Loan
Create a Home Valuation Report for This Property
The Home Valuation Report is an in-depth analysis detailing your home's value as well as a comparison with similar homes in the area
Home Values in the Area
Average Home Value in this Area
Purchase History
| Date | Buyer | Sale Price | Title Company |
|---|---|---|---|
| Aemopolis Frances | -- | None Available | |
| Momcilovic Michael | -- | None Available | |
| Demopolis Frances | -- | None Available | |
| Demopolis Frances | -- | None Available | |
| Demopolis Frances | -- | Able Title Agency Llc |
Source: Public Records
Mortgage History
| Date | Status | Borrower | Loan Amount |
|---|---|---|---|
| Closed | Demopolis Frances | $154,800 |
Source: Public Records
Tax History
| Year | Tax Paid | Tax Assessment Tax Assessment Total Assessment is a certain percentage of the fair market value that is determined by local assessors to be the total taxable value of land and additions on the property. | Land | Improvement |
|---|---|---|---|---|
| 2025 | $2,948 | $115,920 | $0 | $0 |
| 2024 | $29 | $112,460 | $0 | $0 |
| 2023 | $2,801 | $105,940 | $0 | $0 |
| 2022 | $2,758 | $89,750 | $0 | $0 |
| 2021 | $2,746 | $82,630 | $0 | $0 |
| 2020 | $2,592 | $78,430 | $0 | $0 |
| 2019 | $3,558 | $72,370 | $0 | $0 |
| 2018 | $0 | $63,540 | $0 | $0 |
| 2017 | $2,506 | $63,260 | $9,660 | $53,600 |
| 2016 | $2,548 | $63,260 | $0 | $0 |
| 2015 | -- | $55,720 | $0 | $0 |
| 2013 | $4,698 | $43,060 | $0 | $0 |
Source: Public Records
Map
Nearby Homes
- 32549 Gloede Dr
- 14131 Peck Dr
- 15014 Arden Ave
- 33555 Groth Dr
- 32138 Bradner Dr
- 33157 Mccoy Dr
- 33538 Cornelissen Dr
- 15303 Lincolnshire Ln
- 15715 Exeter Ct
- 32852 Eiffel Ave
- 33828 Stonewood Dr
- 15801 Toulouse Unit 6
- 31331 Mc Namee
- 34376 Giannetti Dr
- 15657 Lauren
- 34137 Old Forge Ct
- 31141 Morgan Dr
- 34080 Brookshire Dr
- 31102 Louise Dr
- 13663 Riverwood Dr
- 32627 Beechwood Dr
- 32603 Beechwood Dr
- 32553 Beechwood Dr
- 32639 Beechwood Dr
- 32622 Columbus Dr
- 32610 Columbus Dr
- 32634 Columbus Dr
- 32541 Beechwood Dr
- 32550 Columbus Dr
- 32646 Columbus Dr
- 32651 Beechwood Dr
- 32608 Beechwood Dr
- 32620 Beechwood Dr
- 32558 Beechwood Dr
- 32632 Beechwood Dr
- 32538 Columbus Dr
- 32658 Columbus Dr
- 32529 Beechwood Dr
- 8805 Columbus Dr
- 32546 Beechwood Dr
Your Personal Tour Guide
Ask me questions while you tour the home.