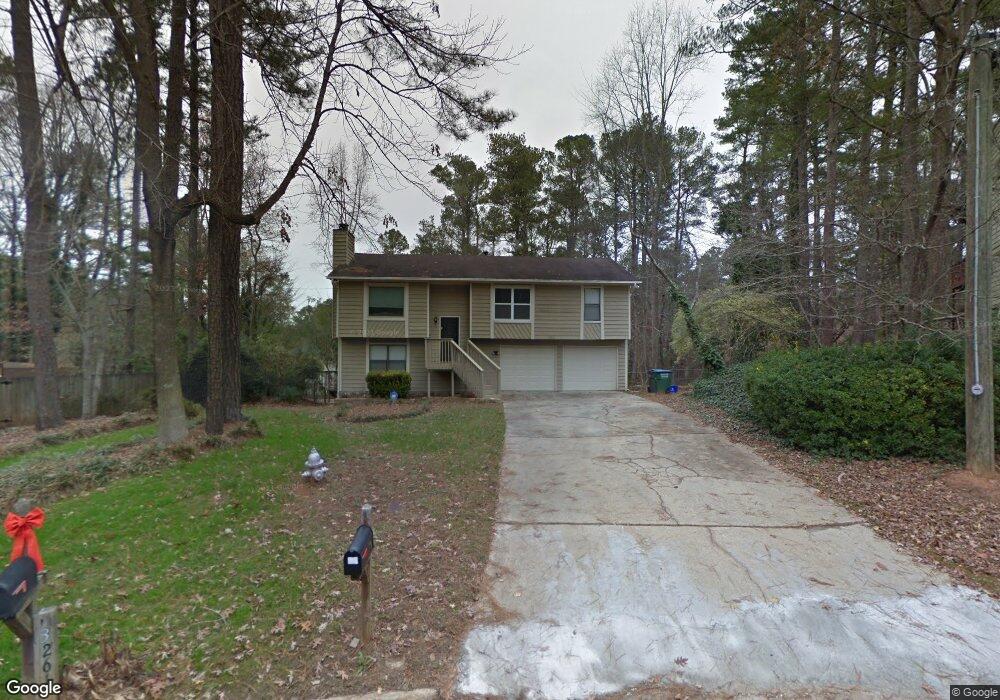
3262 Mixon Way Unit 3 Stone Mountain, GA 30087
Estimated Value: $286,000 - $317,000
4
Beds
4
Baths
1,894
Sq Ft
$159/Sq Ft
Est. Value
About This Home
This home is located at 3262 Mixon Way Unit 3, Stone Mountain, GA 30087 and is currently estimated at $301,903, approximately $159 per square foot. 3262 Mixon Way Unit 3 is a home located in Gwinnett County with nearby schools including Annistown Elementary School, Shiloh Middle School, and Shiloh High School.
Ownership History
Date
Name
Owned For
Owner Type
Purchase Details
Closed on
Jun 30, 2025
Sold by
Cordoba-Estrada Luz D
Bought by
Dean Jonathan William
Current Estimated Value
Home Financials for this Owner
Home Financials are based on the most recent Mortgage that was taken out on this home.
Original Mortgage
$303,905
Outstanding Balance
$303,394
Interest Rate
6.89%
Mortgage Type
New Conventional
Estimated Equity
-$1,491
Purchase Details
Closed on
Sep 29, 2017
Sold by
Not Provided
Bought by
Swh 2017 1 Borrower Lp
Purchase Details
Closed on
Dec 19, 2014
Sold by
Tarbert Llc
Bought by
Sway 2014 1 Borrower Llc
Purchase Details
Closed on
Jan 31, 2014
Sold by
Srp Sub Llc
Bought by
Tarbert Llc and C O Waypoint Homes
Purchase Details
Closed on
Dec 23, 2013
Sold by
Urban Property Solutions L
Bought by
Srp Sub Llc
Purchase Details
Closed on
Oct 21, 2013
Sold by
Morgan Barbara B
Bought by
Urban Property Solutions Llc
Home Financials for this Owner
Home Financials are based on the most recent Mortgage that was taken out on this home.
Original Mortgage
$70,000
Interest Rate
4.52%
Mortgage Type
New Conventional
Create a Home Valuation Report for This Property
The Home Valuation Report is an in-depth analysis detailing your home's value as well as a comparison with similar homes in the area
Home Values in the Area
Average Home Value in this Area
Purchase History
| Date | Buyer | Sale Price | Title Company |
|---|---|---|---|
| Dean Jonathan William | $319,900 | -- | |
| Swh 2017 1 Borrower Lp | -- | -- | |
| Sway 2014 1 Borrower Llc | -- | -- | |
| Tarbert Llc | -- | -- | |
| Srp Sub Llc | $80,000 | -- | |
| Urban Property Solutions Llc | $65,000 | -- |
Source: Public Records
Mortgage History
| Date | Status | Borrower | Loan Amount |
|---|---|---|---|
| Open | Dean Jonathan William | $303,905 | |
| Previous Owner | Urban Property Solutions Llc | $70,000 |
Source: Public Records
Tax History Compared to Growth
Tax History
| Year | Tax Paid | Tax Assessment Tax Assessment Total Assessment is a certain percentage of the fair market value that is determined by local assessors to be the total taxable value of land and additions on the property. | Land | Improvement |
|---|---|---|---|---|
| 2025 | $4,234 | $110,080 | $23,720 | $86,360 |
| 2024 | $3,424 | $86,000 | $23,720 | $62,280 |
| 2023 | $3,424 | $110,080 | $20,000 | $90,080 |
| 2022 | $3,793 | $97,720 | $16,800 | $80,920 |
| 2021 | $2,668 | $65,160 | $12,000 | $53,160 |
| 2020 | $2,681 | $65,160 | $12,000 | $53,160 |
| 2019 | $2,295 | $56,840 | $12,000 | $44,840 |
| 2018 | $2,230 | $55,040 | $12,000 | $43,040 |
| 2016 | $1,558 | $35,360 | $8,000 | $27,360 |
| 2015 | $1,455 | $32,000 | $6,400 | $25,600 |
| 2014 | $1,461 | $32,000 | $6,400 | $25,600 |
Source: Public Records
Map
Nearby Homes
- 3216 Deshong Dr
- 5039 Seabrook Place
- 5045 Carole Place
- 3298 Drummond Dr Unit 2
- 3346 Deshong Dr
- 5115 Carole Place
- 3093 Deshong Dr
- 3191 Mineral Ridge Ln
- 5380 Rock Place Dr
- 3047 Sanibel Dr Unit 1
- 4770 Feather Creek Ct
- 5272 Cumberland Way
- 580 Overlook Dr
- 4667 Old Annistown Bridge Rd
- 2901 Carrousel Ct
- 126 Castle Club Dr
- 2878 Heather Row Ridge SW
- 2877 Heather Row Ridge SW
- 2982 Moorings Pkwy Unit 1
- 4545 Forrest Bend Ct
- 3262 Mixon Way
- 3272 Mixon Way Unit 3
- 3261 Mixon Way
- 3239 Berrong Way Unit 1
- 3243 Deshong Dr
- 3233 Deshong Dr
- 3233 Deshong Dr Unit 2
- 3253 Deshong Dr
- 3282 Mixon Way
- 3223 Deshong Dr
- 3229 Berrong Way
- 3238 Berrong Way Unit 1
- 3271 Mixon Way
- 3281 Mixon Way
- 3263 Deshong Dr Unit 2
- 0 Mixon Way Unit 3152041
- 0 Mixon Way
- 3292 Mixon Way
- 3213 Deshong Dr
- 3273 Deshong Dr