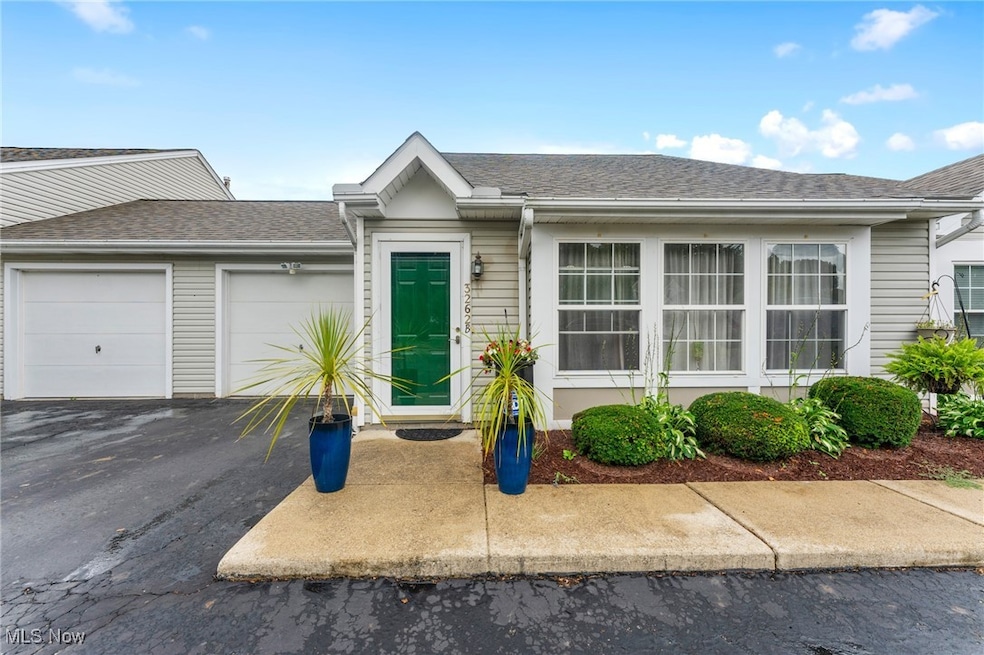

3262 Pheasant Run Rd Unit B Cortland, OH 44410
Estimated payment $1,231/month
Highlights
- Open Floorplan
- Contemporary Architecture
- 1 Car Direct Access Garage
- Lakeview Middle School Rated A-
- High Ceiling
- Walk-In Closet
About This Home
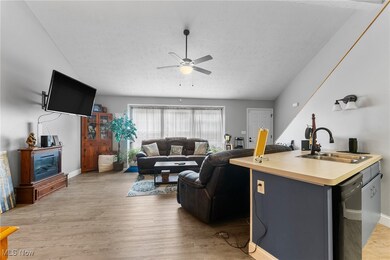
Call today to view this beautiful Condo which has a one-car attached garage, first-floor laundry room, and two bedrooms and two baths!
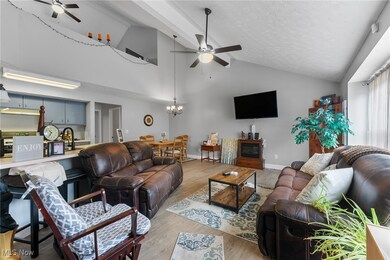
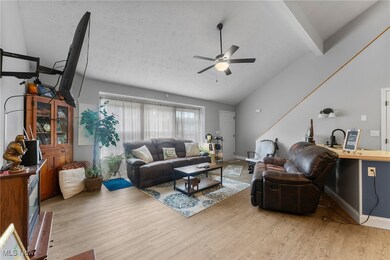
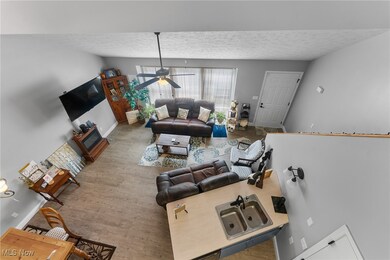
The spacious living and dining areas feature vaulted ceilings and laminate flooring, leading into a kitchen equipped with a breakfast bar. The sizable first-floor bedroom also offers a vaulted ceiling, generous closet space, and a sliding door that opens to a private concrete patio enclosed by a wooden fence. Additionally, the second level comprises a loft bedroom with a walk-in closet and a full bathroom. Don't miss simplified living in this beautifully updated condo. Call today to schedule a showing!
Listing Agent
Howard Hanna Brokerage Email: johneaton@howardhanna.com, 330-219-5758 License #365437 Listed on: 08/26/2025

Property Details
Home Type
- Condominium
Est. Annual Taxes
- $2,180
Year Built
- Built in 1998
Lot Details
- North Facing Home
HOA Fees
- $180 Monthly HOA Fees
Parking
- 1 Car Direct Access Garage
- Garage Door Opener
Home Design
- Contemporary Architecture
- Entry on the 1st floor
- Slab Foundation
- Fiberglass Roof
- Asphalt Roof
- Vinyl Siding
Interior Spaces
- 1,464 Sq Ft Home
- 2-Story Property
- Open Floorplan
- High Ceiling
- Chandelier
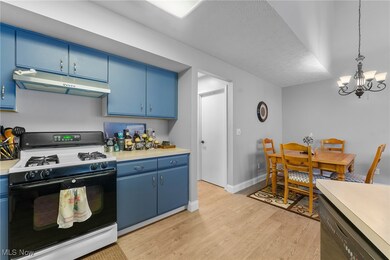
Kitchen
- Breakfast Bar
- Range
- Microwave
- Dishwasher
- Kitchen Island
- Laminate Countertops
- Disposal
Bedrooms and Bathrooms
- 2 Bedrooms | 1 Main Level Bedroom
- Walk-In Closet
- 2 Full Bathrooms
Laundry
- Laundry in unit
- Dryer
- Washer
Utilities
- Forced Air Heating and Cooling System
- Heating System Uses Gas
Listing and Financial Details
- Assessor Parcel Number 31901880
Community Details
Overview
- Association fees include management, insurance, ground maintenance, maintenance structure, reserve fund, snow removal, trash
- Woodland Trails Condos Phase 5 Association
Pet Policy
- Pets Allowed
Map
Home Values in the Area
Average Home Value in this Area
Tax History
| Year | Tax Paid | Tax Assessment Tax Assessment Total Assessment is a certain percentage of the fair market value that is determined by local assessors to be the total taxable value of land and additions on the property. | Land | Improvement |
|---|---|---|---|---|
| 2024 | $2,179 | $43,200 | $3,680 | $39,520 |
| 2023 | $2,179 | $43,200 | $3,680 | $39,520 |
| 2022 | $1,579 | $27,410 | $3,330 | $24,080 |
| 2021 | $1,053 | $27,410 | $3,330 | $24,080 |
| 2020 | $1,059 | $27,410 | $3,330 | $24,080 |
| 2019 | $970 | $25,210 | $3,330 | $21,880 |
| 2018 | $975 | $25,210 | $3,330 | $21,880 |
| 2017 | $973 | $25,210 | $3,330 | $21,880 |
| 2016 | $987 | $24,920 | $3,010 | $21,910 |
| 2015 | $990 | $24,920 | $3,010 | $21,910 |
| 2014 | $910 | $24,920 | $3,010 | $21,910 |
| 2013 | $1,083 | $27,660 | $3,330 | $24,330 |
Property History
| Date | Event | Price | List to Sale | Price per Sq Ft |
|---|---|---|---|---|
| 09/25/2025 09/25/25 | Price Changed | $164,900 | -2.9% | $113 / Sq Ft |
| 08/26/2025 08/26/25 | For Sale | $169,900 | -- | $116 / Sq Ft |
Purchase History
| Date | Type | Sale Price | Title Company |
|---|---|---|---|
| Deed | $126,500 | Bourne Nicholas A | |
| Fiduciary Deed | $48,000 | Attorney | |
| Warranty Deed | $77,375 | -- |
Mortgage History
| Date | Status | Loan Amount | Loan Type |
|---|---|---|---|
| Open | $90,000 | Credit Line Revolving |
Source: MLS Now (Howard Hanna)
MLS Number: 5149105
APN: 31-901880
Disclaimer: Certain information contained herein is derived from information provided by parties other than Homes.com. All information provided is deemed reliable, but is not guaranteed to be accurate and should be independently verified.
![]() Certain information contained herein is derived from information provided by parties other than Homes.com. All information provided is deemed reliable, but is not guaranteed to be accurate and should be independently verified.
Certain information contained herein is derived from information provided by parties other than Homes.com. All information provided is deemed reliable, but is not guaranteed to be accurate and should be independently verified.
- 3122 Ivy Hill Cir Unit A
- 3012 Ivy Hill Cir
- 3093 Ivy Hill Cir Unit D
- 3063 Ivy Hill Cir Unit D
- 2609 Warren Meadville Rd
- 2342 McCleary Jacoby Rd
- 0 Black Duck Ct Unit 5088418
- 0 Black Duck Ct Unit 5133669
- 2526 Hoagland Blackstub Rd
- 2261 Saddlebrook Ln
- 2271 Saddlebrook Ln
- 2352 Hoagland Blackstub Rd
- 0 Niles Ashtabula Rd Unit 5147189
- 2407 Northview Dr
- 4167 N River Rd NE
- 4260 N River Rd NE
- 255 S Linden Ct Unit 3
- 120 N Aspen Ct Unit 3
- 106 N Aspen Ct Unit 4
- 0 Durst Dr
- 150 Seasons Blvd
- 1826 Cranberry Ln NE
- 1267 Rosewood Dr NE
- 10 Sandpiper Trail SE
- 331 Butler Rd NE
- 163 N Mecca St Unit 1st floor home
- 2633 South St SE Unit 221A
- 395 N Mecca St Unit 1
- 55 Avalon Creek Blvd
- 3721 Wilson Sharpsville Rd
- 4307 Harvard Dr SE
- 1379 Mahoning Ave
- 1436 North Rd SE
- 3100 Valley Dale Dr NW
- 271 Folsom St NW Unit 6
- 846 Hunter St NW
- 3500 Boston Ave
- 288 Dickey Ave NW
- 809 Trumbull Dr
- 505 North Rd