Estimated payment $3,031/month
Highlights
- RV or Boat Parking
- Mountain View
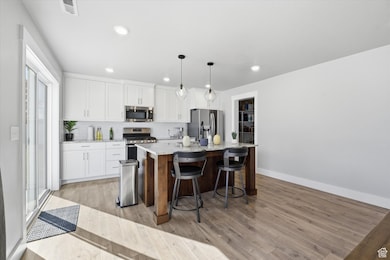
- Granite Countertops
- Heritage School Rated A-
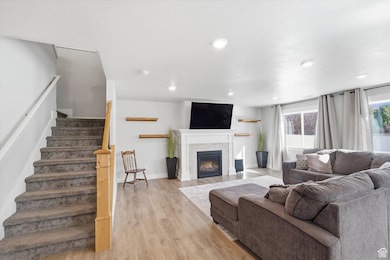
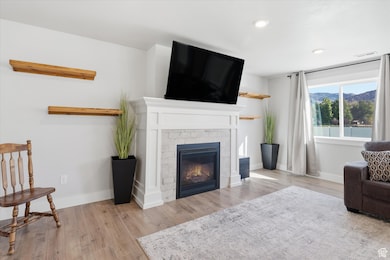
- 1 Fireplace
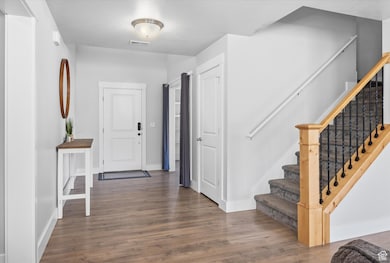
- Mud Room
About This Home
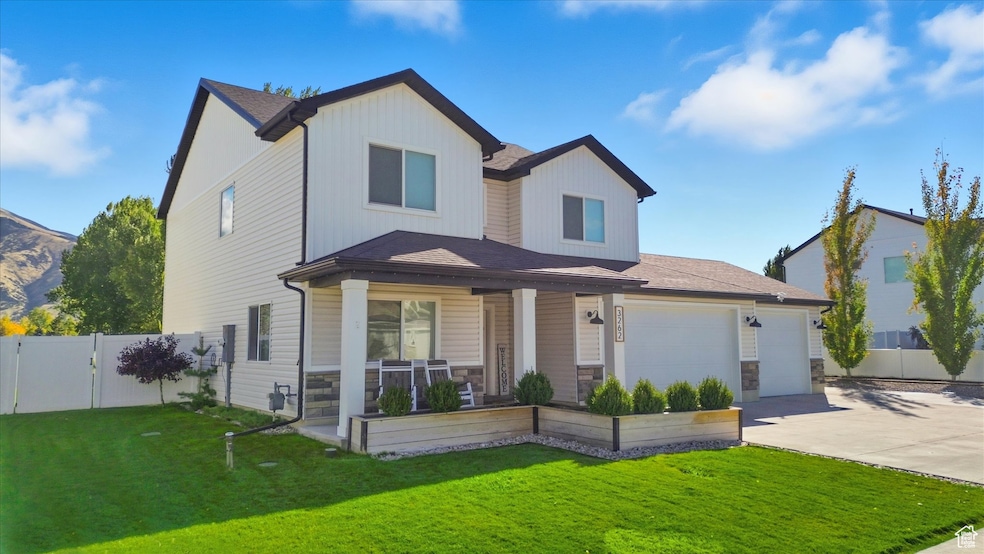
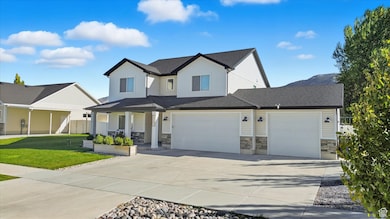
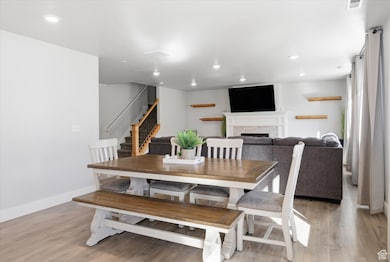
Tucked Away Two-Story Home in Nibley's Apple Creek Neighborhood! Make time to come see this clean and well-kept 3 bedroom, 2.5 bath, 3 car garage home with its large lot and views. Granite kitchen counters, stainless appliances, spacious kitchen/family room space for holiday entertaining, a 2nd family room plus bonus den/office (with built-ins!), mudroom, large primary bath with double sinks and roomy tile shower, garage workbench and shelving, plenty of storage, and parking space for your toys!
Listing Agent
Wyatt Olsen
Boomerang Real Estate Services LLC License #6986699 Listed on: 10/22/2025
Home Details
Home Type
- Single Family
Est. Annual Taxes
- $2,476
Year Built
- Built in 2019
Lot Details
- 0.35 Acre Lot
- Property is Fully Fenced
- Landscaped
- Sprinkler System
- Property is zoned Single-Family
Parking
- 3 Car Attached Garage
- 6 Open Parking Spaces
- RV or Boat Parking
Home Design
- Stone Siding
Interior Spaces
- 2,295 Sq Ft Home
- 2-Story Property
- Ceiling Fan
- 1 Fireplace
- Double Pane Windows
- Blinds
- Sliding Doors
- Mud Room
- Smart Doorbell
- Den
- Mountain Views
- Electric Dryer Hookup
Kitchen
- Gas Oven
- Free-Standing Range
- Microwave
- Granite Countertops
- Disposal
Flooring
- Carpet
- Laminate
- Tile
Bedrooms and Bathrooms
- 3 Bedrooms
- Walk-In Closet
Outdoor Features
- Open Patio
- Porch
Schools
- Nibley Elementary School
- Spring Creek Middle School
- Ridgeline High School
Utilities
- Forced Air Heating and Cooling System
- Natural Gas Connected
Community Details
- No Home Owners Association
- Apple Creek Subdivis Subdivision
Listing and Financial Details
- Exclusions: Refrigerator, Swing Set, Video Camera(s)
- Assessor Parcel Number 03-198-0006
Map
Home Values in the Area
Average Home Value in this Area
Tax History
| Year | Tax Paid | Tax Assessment Tax Assessment Total Assessment is a certain percentage of the fair market value that is determined by local assessors to be the total taxable value of land and additions on the property. | Land | Improvement |
|---|---|---|---|---|
| 2025 | $2,319 | $307,365 | $0 | $0 |
| 2024 | $2,476 | $308,095 | $0 | $0 |
| 2023 | $2,605 | $303,600 | $0 | $0 |
| 2022 | $2,712 | $303,600 | $0 | $0 |
| 2021 | $2,138 | $371,680 | $85,100 | $286,580 |
| 2020 | $2,020 | $334,300 | $85,100 | $249,200 |
| 2019 | $980 | $85,100 | $85,100 | $0 |
Property History
| Date | Event | Price | List to Sale | Price per Sq Ft |
|---|---|---|---|---|
| 11/24/2025 11/24/25 | Price Changed | $534,900 | -1.8% | $233 / Sq Ft |
| 10/22/2025 10/22/25 | For Sale | $544,900 | -- | $237 / Sq Ft |
Purchase History
| Date | Type | Sale Price | Title Company |
|---|---|---|---|
| Warranty Deed | -- | Us Title | |
| Warranty Deed | -- | Cache Title Logan | |
| Warranty Deed | -- | Cache Title Logan |
Mortgage History
| Date | Status | Loan Amount | Loan Type |
|---|---|---|---|
| Open | $420,000 | New Conventional | |
| Previous Owner | $273,500 | Construction |
Source: UtahRealEstate.com
MLS Number: 2118886
APN: 03-198-0006
Disclaimer: Certain information contained herein is derived from information provided by parties other than Homes.com. All information provided is deemed reliable, but is not guaranteed to be accurate and should be independently verified.
![]() IDX information is provided exclusively for consumers’ personal, non-commercial use, that it may not be used for any purpose other than to identify prospective properties consumers may be interested in purchasing, and that the data is deemed reliable but is not guaranteed accurate by the MLS. Licensor is only providing the MLS Content and not other sources of data provided in the Product.
IDX information is provided exclusively for consumers’ personal, non-commercial use, that it may not be used for any purpose other than to identify prospective properties consumers may be interested in purchasing, and that the data is deemed reliable but is not guaranteed accurate by the MLS. Licensor is only providing the MLS Content and not other sources of data provided in the Product.
Based on information from the Wasatch Front Regional Multiple Listing Service, Inc.. All data, including all measurements and calculations of area, is obtained from various sources and has not been, and will not be, verified by broker or the MLS. All information should be independently reviewed and verified for accuracy. Properties may or may not be listed by the office/agent presenting the information.
- 268 W 3400 S Unit 5
- 412 W 3085 S
- 400 W 3085 S
- 262 W 3400 S Unit 11
- 324 W 3400 S Unit 7
- 278 W 3400 S Unit 10
- 294 W 3400 S Unit 9
- 308 W 3400 S Unit 8
- 338 W 3400 S Unit 6
- 406 W 3025 S
- 374 Ropelato Dr
- 3400 S 250 W Unit 2
- Lyndhurst Plan at Ridgeline Park - Nibley (Active Adult)
- Blackberry Plan at Ridgeline Park - Nibley
- Auburn Plan at Ridgeline Park - Nibley
- Auburn Plan at Ridgeline Park - Nibley (Active Adult)
- Hickory Plan at Ridgeline Park - Nibley
- Aberdeen Plan at Ridgeline Park - Nibley
- Hemlock Plan at Ridgeline Park - Nibley
- Boxwood Plan at Ridgeline Park - Nibley