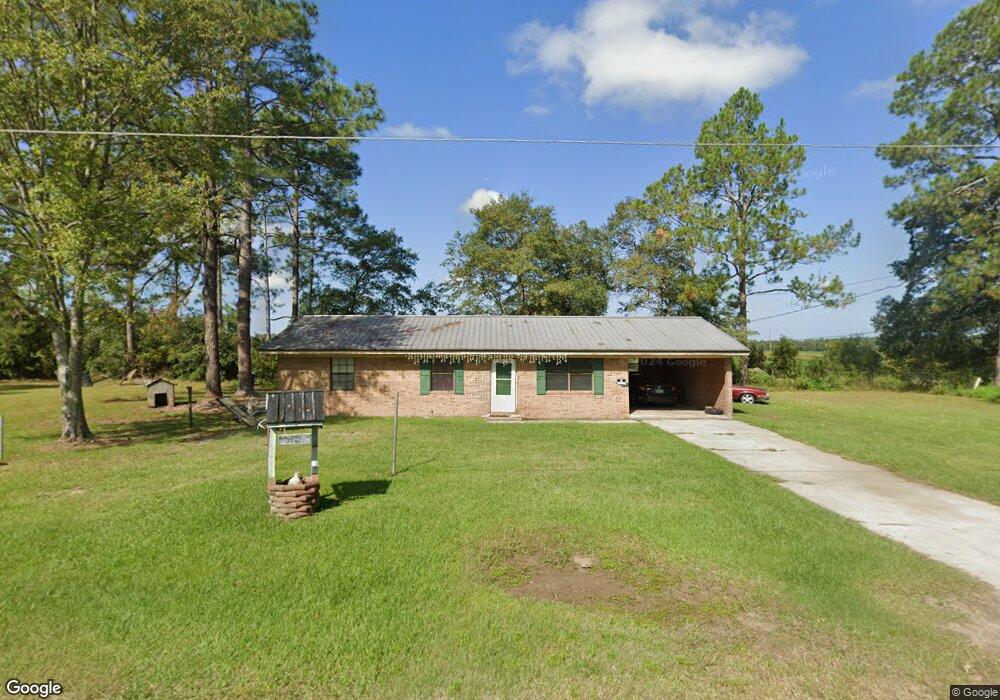
3263 Lucas St Patterson, GA 31557
Estimated Value: $89,210 - $139,000
2
Beds
1
Bath
1,100
Sq Ft
$104/Sq Ft
Est. Value
About This Home
This home is located at 3263 Lucas St, Patterson, GA 31557 and is currently estimated at $114,553, approximately $104 per square foot. 3263 Lucas St is a home located in Pierce County with nearby schools including Pierce County High School and Southeast Christian Academy.
Ownership History
Date
Name
Owned For
Owner Type
Purchase Details
Closed on
Nov 13, 2020
Sold by
Dyal Eric J
Bought by
Edge Grp Llc
Current Estimated Value
Purchase Details
Closed on
Sep 17, 2010
Sold by
Deutsche Bank National Trust Company
Bought by
Dyal Eric and Dyal Greta
Purchase Details
Closed on
Oct 6, 2009
Sold by
Mckinnon Karen
Bought by
Deutsche Bank National Trust Company
Purchase Details
Closed on
Nov 22, 2004
Sold by
Summa Builders Inc
Bought by
Mckinnon Karen
Purchase Details
Closed on
Nov 6, 2001
Sold by
Clark Angelia F
Bought by
Summa Builders Inc
Purchase Details
Closed on
Aug 25, 1982
Sold by
Bowen William Stephen
Bought by
Clark Angelia F
Purchase Details
Closed on
Apr 21, 1982
Sold by
Smiley Charles
Bought by
Bowen William Stephen
Purchase Details
Closed on
Jan 17, 1970
Sold by
Echols Helen W and Hopkins Shirley W
Bought by
Smiley Charles
Create a Home Valuation Report for This Property
The Home Valuation Report is an in-depth analysis detailing your home's value as well as a comparison with similar homes in the area
Purchase History
| Date | Buyer | Sale Price | Title Company |
|---|---|---|---|
| Edge Grp Llc | -- | -- | |
| Dyal Eric | $15,000 | -- | |
| Deutsche Bank National Trust Company | $49,500 | -- | |
| Mckinnon Karen | $68,000 | -- | |
| Summa Builders Inc | $25,600 | -- | |
| Clark Angelia F | -- | -- | |
| Bowen William Stephen | -- | -- | |
| Smiley Charles | $5,000 | -- |
Source: Public Records
Tax History
| Year | Tax Paid | Tax Assessment Tax Assessment Total Assessment is a certain percentage of the fair market value that is determined by local assessors to be the total taxable value of land and additions on the property. | Land | Improvement |
|---|---|---|---|---|
| 2025 | $862 | $26,722 | $1,152 | $25,570 |
| 2024 | $813 | $25,884 | $1,152 | $24,732 |
| 2023 | $799 | $25,414 | $1,152 | $24,262 |
| 2022 | $785 | $22,149 | $1,069 | $21,080 |
| 2021 | $805 | $21,255 | $1,069 | $20,186 |
| 2020 | $781 | $20,362 | $1,069 | $19,293 |
| 2019 | $780 | $20,362 | $1,069 | $19,293 |
| 2018 | $748 | $19,469 | $1,069 | $18,400 |
| 2017 | $729 | $18,933 | $1,069 | $17,864 |
| 2016 | $728 | $18,933 | $1,069 | $17,864 |
| 2015 | $507 | $18,932 | $1,069 | $17,864 |
| 2014 | $507 | $18,933 | $1,069 | $17,864 |
| 2013 | $507 | $18,932 | $1,068 | $17,864 |
Source: Public Records
Map
Nearby Homes
- 3285 Tyre Bridge Rd
- 3231 Pear Ave
- 5661 E Railroad Ave
- 0 Eden Rd
- 3501 Martin St
- 5574 Walkerville Rd
- 3442 Wildwood Ave
- 3540 Williams St
- 5518 W Railroad Ave
- 3432 Nellie St
- 3440 Nellie St
- 5772 Industrial Blvd
- 5209 Georgia 32
- 5209 Ga Highway 32
- 3587 Cathleen Dr
- 6193 Offerman Loop
- 2114 Mill Creek Rd
- 6005 Chancey Rd
- 6204 Cross Swamp Rd
- 5466 Robin Rd
- 3255 Lucas St
- 3266 Lucas St
- 3620 Lucas St
- 3275 Lucas St
- 3272 Lucas St
- 3249 Lucas St
- 3252 Lucas St
- 3276 Lucas St
- 3281 Lucas St
- 3319 Tyre Bridge Rd
- 3303 Tyre Bridge Rd
- 3309 Tyre Bridge Rd
- 3327 Tyre Bridge Rd
- 3287 Lucas St
- 3239 Lucas St
- 3286 Lucas St
- 3295 Tyre Bridge Rd
- 3291 Tyre Bridge Rd
- 3312 Tyre Bridge Rd
- 3293 Lucas St
Your Personal Tour Guide
Ask me questions while you tour the home.