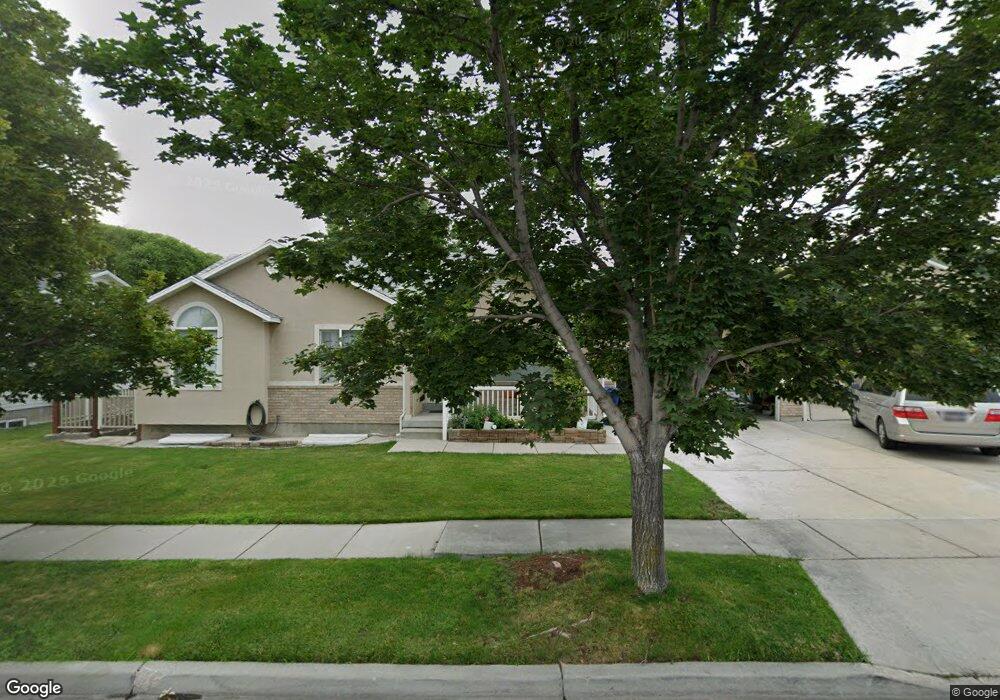
3263 Newmark Dr Salt Lake City, UT 84128
Hunter NeighborhoodEstimated Value: $505,000 - $570,000
5
Beds
3
Baths
2,801
Sq Ft
$189/Sq Ft
Est. Value
About This Home
This home is located at 3263 Newmark Dr, Salt Lake City, UT 84128 and is currently estimated at $528,302, approximately $188 per square foot. 3263 Newmark Dr is a home located in Salt Lake County with nearby schools including West Valley Elementary School, Hunter Jr High School, and Cyprus High School.
Ownership History
Date
Name
Owned For
Owner Type
Purchase Details
Closed on
Dec 1, 2011
Sold by
Truong Bach Ngoc and Vo Thuy
Bought by
Truong Bach Ngoc and Vo Thuy
Current Estimated Value
Home Financials for this Owner
Home Financials are based on the most recent Mortgage that was taken out on this home.
Original Mortgage
$165,550
Outstanding Balance
$113,519
Interest Rate
4.06%
Mortgage Type
New Conventional
Estimated Equity
$414,783
Purchase Details
Closed on
Oct 25, 2005
Sold by
Jones Carl M and Jones Ruth
Bought by
Truong Bach Ngoc
Home Financials for this Owner
Home Financials are based on the most recent Mortgage that was taken out on this home.
Original Mortgage
$178,220
Interest Rate
5.68%
Mortgage Type
Purchase Money Mortgage
Purchase Details
Closed on
Jan 9, 2001
Sold by
D R Horton Inc
Bought by
Jones Carl M and Jones Ruth
Home Financials for this Owner
Home Financials are based on the most recent Mortgage that was taken out on this home.
Original Mortgage
$154,415
Interest Rate
7.65%
Mortgage Type
VA
Create a Home Valuation Report for This Property
The Home Valuation Report is an in-depth analysis detailing your home's value as well as a comparison with similar homes in the area
Home Values in the Area
Average Home Value in this Area
Purchase History
| Date | Buyer | Sale Price | Title Company |
|---|---|---|---|
| Truong Bach Ngoc | -- | Monument Title Ins Co | |
| Truong Bach Ngoc | -- | First American Title | |
| Jones Carl M | -- | First American |
Source: Public Records
Mortgage History
| Date | Status | Borrower | Loan Amount |
|---|---|---|---|
| Open | Truong Bach Ngoc | $165,550 | |
| Closed | Truong Bach Ngoc | $178,220 | |
| Previous Owner | Jones Carl M | $154,415 |
Source: Public Records
Tax History Compared to Growth
Tax History
| Year | Tax Paid | Tax Assessment Tax Assessment Total Assessment is a certain percentage of the fair market value that is determined by local assessors to be the total taxable value of land and additions on the property. | Land | Improvement |
|---|---|---|---|---|
| 2025 | $3,073 | $505,500 | $138,600 | $366,900 |
| 2024 | $3,073 | $469,100 | $130,800 | $338,300 |
| 2023 | $2,990 | $436,900 | $129,200 | $307,700 |
| 2022 | $3,066 | $449,300 | $125,400 | $323,900 |
| 2021 | $2,669 | $351,500 | $96,900 | $254,600 |
| 2020 | $2,559 | $318,000 | $85,500 | $232,500 |
| 2019 | $2,529 | $303,100 | $85,500 | $217,600 |
| 2018 | $2,370 | $274,400 | $67,500 | $206,900 |
| 2017 | $2,184 | $257,100 | $67,500 | $189,600 |
| 2016 | $1,853 | $218,500 | $62,100 | $156,400 |
| 2015 | $1,804 | $202,500 | $72,900 | $129,600 |
| 2014 | $1,709 | $188,000 | $68,400 | $119,600 |
Source: Public Records
Map
Nearby Homes
- 3142 S Sugar Bowl Ln
- 3038 S Timeron Dr
- 6152 W 3500 S
- 6122 W Country Apple Ct
- 5724 W Darle Ave
- 3589 S Deann Dr
- 2892 Malcolm Place Unit 13
- 2949 Winston Dr W
- 6080 W Brook Hollow Dr
- 2868 S Ritter Row
- 2866 S Ritter Row
- 2885 S Malcolm Place
- 2860 S Ritter Row Unit 50
- 2853 S Kinsey Ct Unit 46
- 2858 S Ritter Row Unit 51
- 2858 S Ritter Row
- 2865 S Ritter Row Unit 55
- 2857 S Ritter Row Unit 57
- 6081 W Parkway Blvd Unit CAMBR
- 6374 W 3100 S
- 3251 S Newmark Dr
- 3275 Newmark Dr
- 3251 Newmark Dr
- 3275 S Newmark Dr
- 3260 Fieldmint Ln
- 3260 S Fieldmint Ln
- 3260 S Fieldmint Ln Unit 404
- 3248 S Fieldmint Ln
- 3272 S Fieldmint Ln
- 3272 Fieldmint Ln
- 3248 Fieldmint Ln
- 3272 S Fieldmint Ln Unit 403
- 3248 S Fieldmint Ln Unit 405
- 3270 S Newmark Dr
- 3270 Newmark Dr
- 3258 Newmark Dr
- 3239 Newmark Dr
- 3239 S Newmark Dr
- 3287 Newmark Dr
- 3236 S Fieldmint Ln