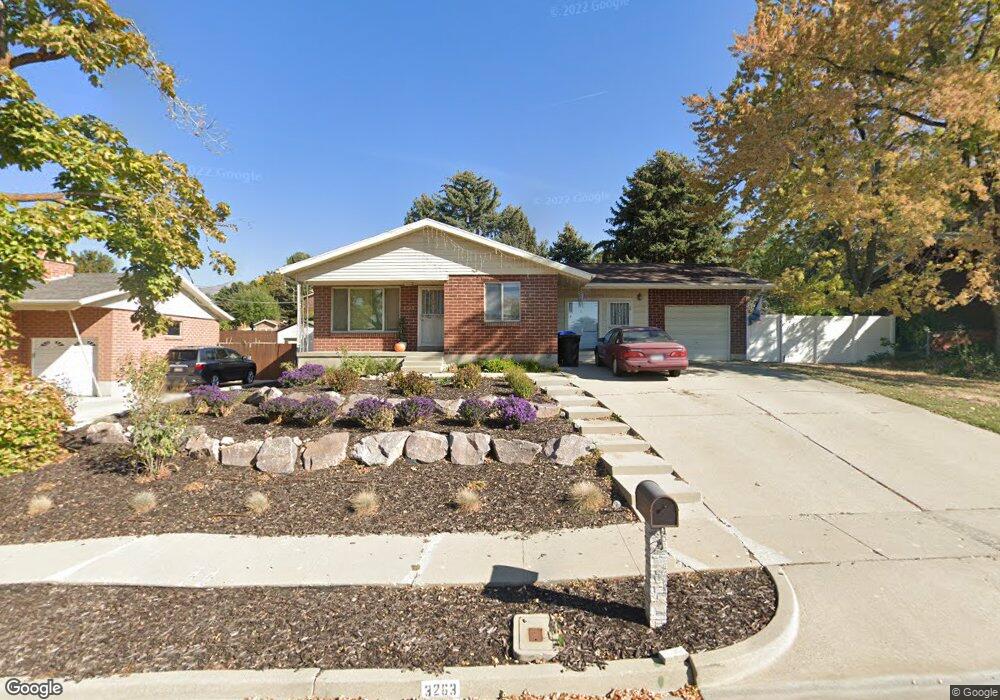
3263 S 350 W Bountiful, UT 84010
Estimated Value: $563,000 - $625,000
5
Beds
3
Baths
3,223
Sq Ft
$188/Sq Ft
Est. Value
About This Home
This home is located at 3263 S 350 W, Bountiful, UT 84010 and is currently estimated at $604,363, approximately $187 per square foot. 3263 S 350 W is a home located in Davis County with nearby schools including Adelaide School, South Davis Junior High School, and Woods Cross High School.
Ownership History
Date
Name
Owned For
Owner Type
Purchase Details
Closed on
Feb 27, 2025
Sold by
Boren Dean G and Boren Leslie N
Bought by
Dean And Natasha Boren Revocable Trust and Boren
Current Estimated Value
Purchase Details
Closed on
Jun 6, 2002
Sold by
Parker Todd and Parker Allison
Bought by
Boren Leslie N and Boren Dean G
Home Financials for this Owner
Home Financials are based on the most recent Mortgage that was taken out on this home.
Original Mortgage
$55,000
Interest Rate
6.25%
Purchase Details
Closed on
Oct 27, 2000
Sold by
Erma Helquist Redd Family Protection Tr and Redd Erma Helquist
Bought by
Parker Todd and Parker Allison
Home Financials for this Owner
Home Financials are based on the most recent Mortgage that was taken out on this home.
Original Mortgage
$127,100
Interest Rate
7.89%
Purchase Details
Closed on
Apr 14, 1999
Sold by
Redd John Packard and Redd Erma Helquist
Bought by
Redd Erma Helquist and Redd John Packard
Create a Home Valuation Report for This Property
The Home Valuation Report is an in-depth analysis detailing your home's value as well as a comparison with similar homes in the area
Purchase History
| Date | Buyer | Sale Price | Title Company |
|---|---|---|---|
| Dean And Natasha Boren Revocable Trust | -- | None Listed On Document | |
| Dean And Natasha Boren Revocable Trust | -- | None Listed On Document | |
| Boren Leslie N | -- | Associated Title Company | |
| Parker Todd | -- | Aspen Title Insurance Agency | |
| Redd Erma Helquist | -- | -- |
Source: Public Records
Mortgage History
| Date | Status | Borrower | Loan Amount |
|---|---|---|---|
| Previous Owner | Boren Leslie N | $55,000 | |
| Previous Owner | Parker Todd | $127,100 | |
| Closed | Parker Todd | $23,800 |
Source: Public Records
Tax History
| Year | Tax Paid | Tax Assessment Tax Assessment Total Assessment is a certain percentage of the fair market value that is determined by local assessors to be the total taxable value of land and additions on the property. | Land | Improvement |
|---|---|---|---|---|
| 2025 | $3,384 | $311,850 | $138,507 | $173,343 |
| 2024 | $3,229 | $302,501 | $125,659 | $176,842 |
| 2023 | $3,118 | $527,000 | $229,443 | $297,557 |
| 2022 | $3,259 | $308,551 | $124,823 | $183,728 |
| 2021 | $2,772 | $401,000 | $163,433 | $237,567 |
| 2020 | $2,519 | $366,000 | $138,860 | $227,140 |
| 2019 | $2,491 | $357,000 | $141,657 | $215,343 |
| 2018 | $2,336 | $330,000 | $138,746 | $191,254 |
| 2016 | $1,929 | $154,220 | $45,775 | $108,445 |
| 2015 | $1,918 | $144,980 | $45,775 | $99,205 |
| 2014 | $1,977 | $152,818 | $45,775 | $107,043 |
| 2013 | -- | $124,078 | $41,774 | $82,304 |
Source: Public Records
Map
Nearby Homes
Your Personal Tour Guide
Ask me questions while you tour the home.