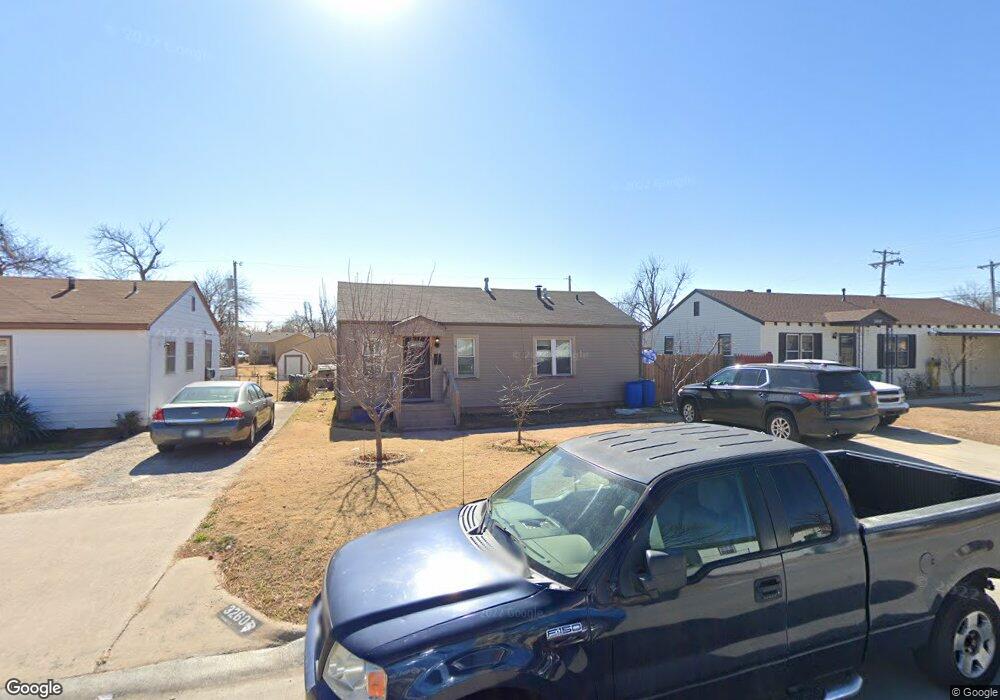
3264 SW 45th St Oklahoma City, OK 73119
Mayridge NeighborhoodEstimated Value: $91,000 - $114,534
3
Beds
1
Bath
840
Sq Ft
$125/Sq Ft
Est. Value
About This Home
This home is located at 3264 SW 45th St, Oklahoma City, OK 73119 and is currently estimated at $104,884, approximately $124 per square foot. 3264 SW 45th St is a home located in Oklahoma County with nearby schools including Arthur Elementary School, Roosevelt Middle School, and U. S. Grant High School.
Ownership History
Date
Name
Owned For
Owner Type
Purchase Details
Closed on
Jul 2, 2014
Sold by
Band Properties Llc
Bought by
Garcia Alvarez Fabian and Lopez Contreras Guadalupe Y
Current Estimated Value
Home Financials for this Owner
Home Financials are based on the most recent Mortgage that was taken out on this home.
Original Mortgage
$36,352
Outstanding Balance
$27,720
Interest Rate
4.19%
Mortgage Type
Purchase Money Mortgage
Estimated Equity
$77,164
Purchase Details
Closed on
Oct 5, 2005
Sold by
Louque Doug and Louque Kathleen M
Bought by
Band Properties Llc
Home Financials for this Owner
Home Financials are based on the most recent Mortgage that was taken out on this home.
Original Mortgage
$44,639
Interest Rate
6.3%
Mortgage Type
Purchase Money Mortgage
Purchase Details
Closed on
Aug 1, 2005
Sold by
Paulk Lavonne
Bought by
Louque Doug
Purchase Details
Closed on
Jul 19, 2005
Sold by
Dollins Dianna and Dollins William
Bought by
Paulk Lavonne
Create a Home Valuation Report for This Property
The Home Valuation Report is an in-depth analysis detailing your home's value as well as a comparison with similar homes in the area
Home Values in the Area
Average Home Value in this Area
Purchase History
| Date | Buyer | Sale Price | Title Company |
|---|---|---|---|
| Garcia Alvarez Fabian | $45,000 | Multiple | |
| Band Properties Llc | -- | -- | |
| Louque Doug | $38,500 | -- | |
| Stuart Brad | -- | Oklahoma City Abstract & Tit | |
| Paulk Lavonne | -- | Oklahoma City Abstract & Tit |
Source: Public Records
Mortgage History
| Date | Status | Borrower | Loan Amount |
|---|---|---|---|
| Open | Garcia Alvarez Fabian | $36,352 | |
| Previous Owner | Band Properties Llc | $44,639 |
Source: Public Records
Tax History Compared to Growth
Tax History
| Year | Tax Paid | Tax Assessment Tax Assessment Total Assessment is a certain percentage of the fair market value that is determined by local assessors to be the total taxable value of land and additions on the property. | Land | Improvement |
|---|---|---|---|---|
| 2024 | $604 | $6,289 | $810 | $5,479 |
| 2023 | $604 | $6,106 | $946 | $5,160 |
| 2022 | $555 | $5,928 | $1,019 | $4,909 |
| 2021 | $534 | $5,755 | $956 | $4,799 |
| 2020 | $520 | $5,588 | $1,071 | $4,517 |
| 2019 | $500 | $5,426 | $1,011 | $4,415 |
| 2018 | $483 | $5,268 | $0 | $0 |
| 2017 | $465 | $5,114 | $1,109 | $4,005 |
| 2016 | $449 | $4,964 | $1,123 | $3,841 |
| 2015 | $437 | $4,820 | $1,145 | $3,675 |
| 2014 | $454 | $3,993 | $1,145 | $2,848 |
Source: Public Records
Map
Nearby Homes
- 3308 SW 47th St
- 3225 SW 46th St
- 4709 S By Pass Terrace
- 3220 SW 48th St
- 3333 SW 50th St
- 4021 S Drexel Ave
- 3601 SW 41st St
- 3522 SW 39th St
- 3013 SW 40th Place
- 3713 SW 44th St
- 3615 SW 40th St
- 2924 SW 51st St
- 2850 SW 40th St
- 3704 SW 40th St
- 2753 SW 46th Place
- 2725 Texoma Dr
- 3616 S Parkview Ave
- 2712 SW 45th St
- 3720 SW 40th Place
- 2836 SW 53rd St
- 3260 SW 45th St
- 3268 SW 45th St
- 3256 SW 45th St
- 3265 SW 46th St
- 3261 SW 46th St
- 3252 SW 45th St
- 3269 SW 46th St
- 3257 SW 46th St
- 3265 SW 45th St
- 3269 SW 45th St
- 3301 SW 46th St
- 3261 SW 45th St
- 3248 SW 45th St
- 3253 SW 46th St
- 3257 SW 45th St
- 3253 SW 45th St
- 3249 SW 46th St
- 3244 SW 45th St
- 3305 SW 46th St
- 3249 SW 45th St