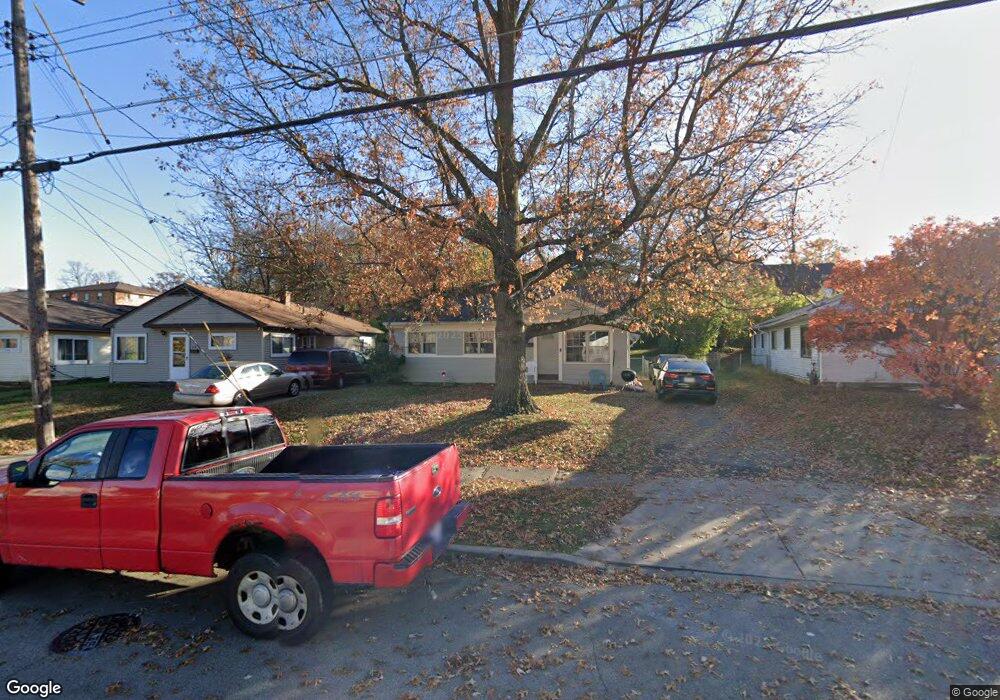
3265 Lapland Dr Cincinnati, OH 45239
Estimated Value: $150,000 - $170,000
3
Beds
1
Bath
918
Sq Ft
$174/Sq Ft
Est. Value
About This Home
This home is located at 3265 Lapland Dr, Cincinnati, OH 45239 and is currently estimated at $159,644, approximately $173 per square foot. 3265 Lapland Dr is a home located in Hamilton County with nearby schools including White Oak Middle School, Colerain High School, and Cincinnati Achievement Academy.
Ownership History
Date
Name
Owned For
Owner Type
Purchase Details
Closed on
Sep 1, 2021
Sold by
Oaks Property Group Llc
Bought by
Rp2ham Llc
Current Estimated Value
Purchase Details
Closed on
Aug 31, 2006
Sold by
Ostendorf Matt
Bought by
Coldiron Brent L and Coldiron Joyce E
Home Financials for this Owner
Home Financials are based on the most recent Mortgage that was taken out on this home.
Original Mortgage
$91,753
Interest Rate
8.5%
Mortgage Type
Unknown
Purchase Details
Closed on
May 20, 2005
Sold by
Hud
Bought by
Ostendorf Matt
Purchase Details
Closed on
Jan 11, 2005
Sold by
Federal National Mortgage Association
Bought by
Hud
Purchase Details
Closed on
Jun 24, 1998
Sold by
Thesken Roger L and Thesken Geraldine Ann
Bought by
Redmon Mary M
Home Financials for this Owner
Home Financials are based on the most recent Mortgage that was taken out on this home.
Original Mortgage
$62,576
Interest Rate
7.27%
Mortgage Type
FHA
Create a Home Valuation Report for This Property
The Home Valuation Report is an in-depth analysis detailing your home's value as well as a comparison with similar homes in the area
Home Values in the Area
Average Home Value in this Area
Purchase History
| Date | Buyer | Sale Price | Title Company |
|---|---|---|---|
| Rp2ham Llc | $105,000 | None Available | |
| Oaks Property Group Llc | $83,000 | None Available | |
| Coldiron Brent L | $91,800 | Priority Land Title Agency | |
| Ostendorf Matt | $48,000 | Lakeside Title & Escrow Agen | |
| Hud | -- | None Available | |
| Redmon Mary M | $63,000 | -- |
Source: Public Records
Mortgage History
| Date | Status | Borrower | Loan Amount |
|---|---|---|---|
| Previous Owner | Coldiron Brent L | $91,753 | |
| Previous Owner | Redmon Mary M | $62,576 |
Source: Public Records
Tax History
| Year | Tax Paid | Tax Assessment Tax Assessment Total Assessment is a certain percentage of the fair market value that is determined by local assessors to be the total taxable value of land and additions on the property. | Land | Improvement |
|---|---|---|---|---|
| 2025 | $2,178 | $36,751 | $11,435 | $25,316 |
| 2023 | $2,050 | $36,751 | $11,435 | $25,316 |
| 2022 | $1,699 | $24,875 | $10,094 | $14,781 |
| 2021 | $1,715 | $24,875 | $10,094 | $14,781 |
| 2020 | $1,695 | $24,875 | $10,094 | $14,781 |
| 2019 | $1,474 | $20,062 | $8,141 | $11,921 |
| 2018 | $1,328 | $20,062 | $8,141 | $11,921 |
| 2017 | $1,276 | $20,062 | $8,141 | $11,921 |
| 2016 | $1,494 | $22,967 | $8,141 | $14,826 |
| 2015 | $1,487 | $22,967 | $8,141 | $14,826 |
| 2014 | $1,492 | $22,967 | $8,141 | $14,826 |
| 2013 | $1,496 | $24,175 | $8,568 | $15,607 |
Source: Public Records
Map
Nearby Homes
- 6264 Seiler Dr
- 3209 Autumn Ln
- 3191 Preserve Ln
- 3250 March Terrace
- 6321 Duet Ln
- 3181 Preserve Ln
- 3181 Preserve Ln Unit 1C
- 3407 Lapland Dr
- 6893 Newbridge Dr
- 3161 Preserve Ln Unit 3D
- 3161 Preserve Ln
- 3219 Banning Rd
- 3150 Banning Rd
- 3236 Deborah Ln
- 5979 Fawnridge Ct
- 6724 Cheviot Rd
- 5858 Giffindale Dr
- 3510 Banning Rd
- 3329 Alexis Rd
- 2937 Blue Rock Rd
- 3261 Lapland Dr
- 3269 Lapland Dr
- 3257 Lapland Dr
- 3266 Blueacres Dr
- 3272 Blueacres Dr
- 3260 Blueacres Dr
- 3253 Lapland Dr
- 3278 Blueacres Dr
- 3277 Lapland Dr
- 3284 Blueacres Dr
- 3260 Lapland Dr
- 3266 Lapland Dr
- 3281 Lapland Dr
- 3272 Lapland Dr
- 3254 Lapland Dr
- 3290 Blueacres Dr
- 3278 Lapland Dr
- 3247 Lapland Dr
- 3285 Lapland Dr
- 3296 Blueacres Dr
Your Personal Tour Guide
Ask me questions while you tour the home.