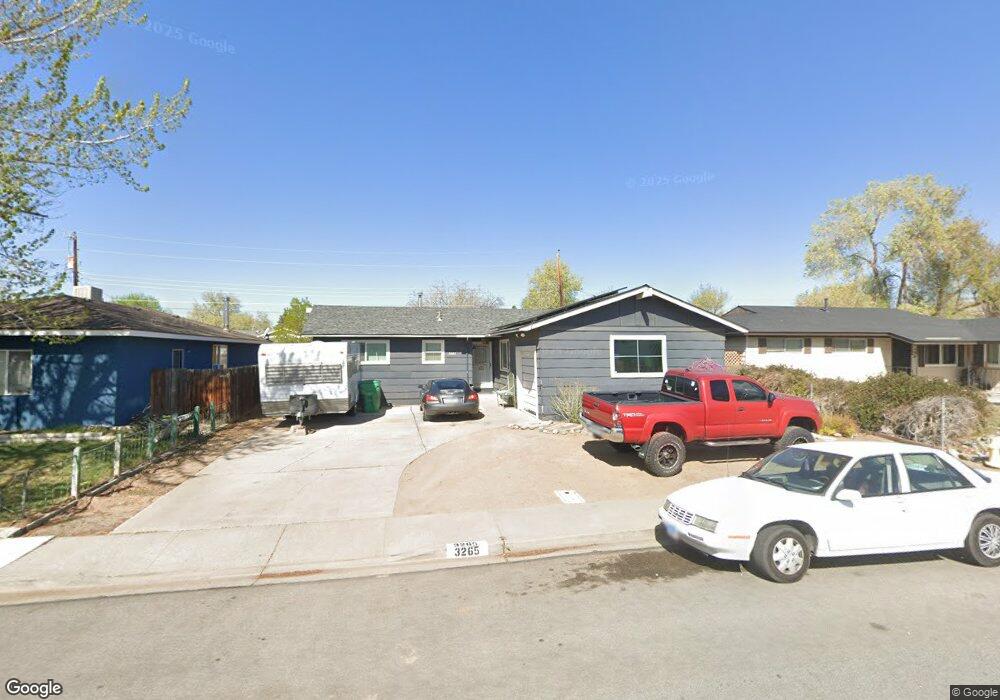
3265 Lucerne Way Sparks, NV 89431
McCarran Boulevard-Probasco NeighborhoodEstimated Value: $416,998 - $435,000
3
Beds
2
Baths
1,344
Sq Ft
$315/Sq Ft
Est. Value
About This Home
This home is located at 3265 Lucerne Way, Sparks, NV 89431 and is currently estimated at $423,750, approximately $315 per square foot. 3265 Lucerne Way is a home located in Washoe County with nearby schools including Hershal H. Beam Elementary School, Lena Juniper Elementary School, and Lou Mendive Middle School.
Ownership History
Date
Name
Owned For
Owner Type
Purchase Details
Closed on
Aug 20, 2018
Sold by
Stimac Marcella and Depaoli Karen
Bought by
Depaoli Karen L
Current Estimated Value
Home Financials for this Owner
Home Financials are based on the most recent Mortgage that was taken out on this home.
Original Mortgage
$55,962
Interest Rate
6.12%
Mortgage Type
FHA
Purchase Details
Closed on
Feb 14, 2017
Sold by
Stimac Marcella and Depaoli Geraldine I
Bought by
Stimac Marcella
Purchase Details
Closed on
Jun 25, 2007
Sold by
Depaoli Geraldine I
Bought by
Depaoli Geraldine I and The Geraldine Depaoli Revocable Trust
Purchase Details
Closed on
Jul 2, 2003
Sold by
Depaoli Geraldine
Bought by
Depaoli Geraldine I and The Geraldine I Depaoli Trust
Create a Home Valuation Report for This Property
The Home Valuation Report is an in-depth analysis detailing your home's value as well as a comparison with similar homes in the area
Home Values in the Area
Average Home Value in this Area
Purchase History
| Date | Buyer | Sale Price | Title Company |
|---|---|---|---|
| Depaoli Karen L | $278,000 | First American Title Ins Co | |
| Stimac Marcella | -- | None Available | |
| Depaoli Geraldine I | -- | None Available | |
| Depaoli Geraldine I | -- | -- |
Source: Public Records
Mortgage History
| Date | Status | Borrower | Loan Amount |
|---|---|---|---|
| Previous Owner | Depaoli Karen L | $55,962 |
Source: Public Records
Tax History Compared to Growth
Tax History
| Year | Tax Paid | Tax Assessment Tax Assessment Total Assessment is a certain percentage of the fair market value that is determined by local assessors to be the total taxable value of land and additions on the property. | Land | Improvement |
|---|---|---|---|---|
| 2025 | $2,007 | $51,924 | $33,565 | $18,359 |
| 2024 | $2,007 | $48,144 | $30,065 | $18,079 |
| 2023 | $708 | $48,059 | $31,325 | $16,734 |
| 2022 | $688 | $39,813 | $26,180 | $13,633 |
| 2021 | $668 | $31,262 | $17,955 | $13,307 |
| 2020 | $648 | $29,996 | $16,940 | $13,056 |
| 2019 | $628 | $28,238 | $15,890 | $12,348 |
| 2018 | $609 | $23,553 | $11,725 | $11,828 |
| 2017 | $584 | $22,007 | $10,395 | $11,612 |
| 2016 | $570 | $20,984 | $9,345 | $11,639 |
| 2015 | $569 | $19,102 | $7,700 | $11,402 |
| 2014 | $552 | $17,167 | $6,440 | $10,727 |
| 2013 | -- | $14,701 | $4,270 | $10,431 |
Source: Public Records
Map
Nearby Homes
- 3595 Rocky Ridge Ct
- 3245 Elaine Way
- 120 E Lenwood Dr
- 3104 Sandy St
- 3071 Meadowlands Dr
- 3200 Bristle Branch Dr
- 3198 Bristle Branch Dr
- 3188 Bristle Branch Dr
- 3167 Bristle Branch Dr
- 3545 4th St
- 3465 Dawn Cir
- 119 Devere Way
- 930 Spanish Springs Rd
- 10 Sheridan Way
- 3607 Keogh Dr
- 745 Glen Vista Dr
- 465 Lenwood Dr
- 780 Emerson Way
- 1069 Palmwood Dr
- 1128 Bradley Square
- 3275 Lucerne Way
- 3255 Lucerne Way
- 3260 Delna Dr
- 3250 Delna Dr
- 3285 Lucerne Way
- 3245 Lucerne Way
- 3270 Delna Dr
- 3270 Lucerne Way
- 3240 Delna Dr
- 3280 Delna Dr
- 3280 Lucerne Way
- 3235 Lucerne Way
- 3305 Lucerne Way
- 3250 Lucerne Way
- 3290 Lucerne Way
- 3230 Delna Dr
- 3240 Lucerne Way
- 3315 Lucerne Way
- 3225 Lucerne Way
- 3310 Lucerne Way