Estimated Value: $295,945 - $358,000
2
Beds
2
Baths
1,497
Sq Ft
$228/Sq Ft
Est. Value
About This Home
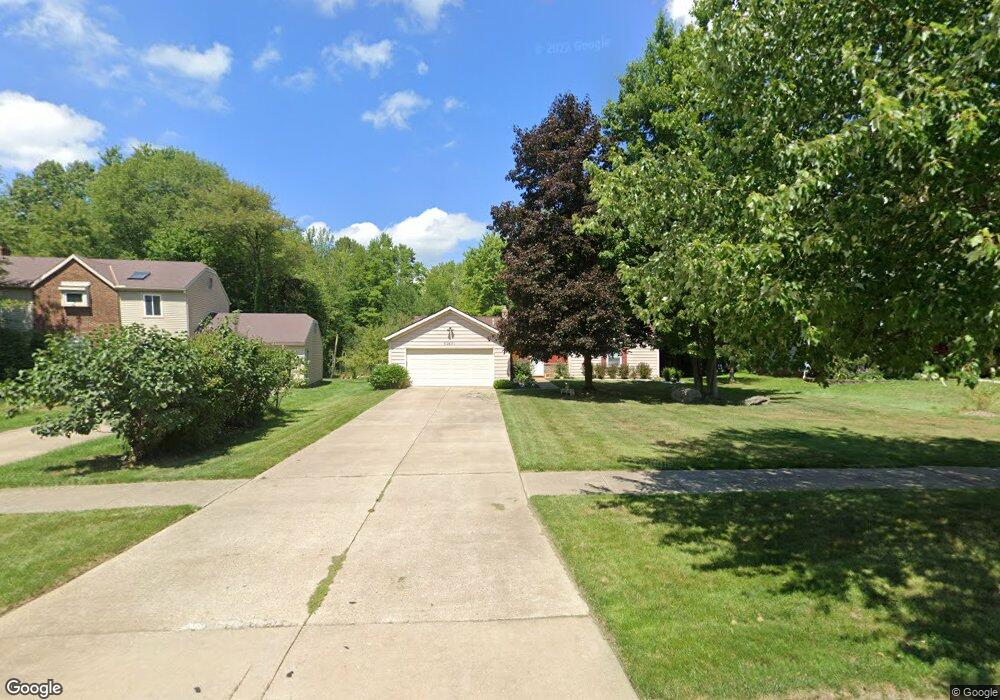
This home is located at 32671 N Roundhead Dr, Solon, OH 44139 and is currently estimated at $341,236, approximately $227 per square foot. 32671 N Roundhead Dr is a home located in Cuyahoga County with nearby schools including Orchard Middle School, Grace L Roxbury Elementary School, and Solon Middle School.
Ownership History
Date
Name
Owned For
Owner Type
Purchase Details
Closed on
Apr 11, 2011
Sold by
Wonnell Jan
Bought by
Barabas Janet
Current Estimated Value
Purchase Details
Closed on
Jul 14, 2001
Sold by
Kraiger Eleanore M
Bought by
Wonnell Jan
Home Financials for this Owner
Home Financials are based on the most recent Mortgage that was taken out on this home.
Original Mortgage
$115,500
Interest Rate
7.27%
Purchase Details
Closed on
Mar 28, 1985
Sold by
Kraiger Fred and Kraiger Eleanore M
Bought by
Kraiger Fred and Kraiger Eleanore M
Purchase Details
Closed on
Aug 10, 1982
Bought by
Kraiger Fred and Kraiger Eleanore M
Purchase Details
Closed on
Dec 4, 1980
Bought by
Dinallo & Wittrup Homes Inc
Purchase Details
Closed on
May 19, 1977
Bought by
D C Winslow Construction Co
Purchase Details
Closed on
Jun 21, 1976
Bought by
Sunrise Dev Co
Purchase Details
Closed on
Jan 1, 1976
Bought by
Solon Dev Co
Create a Home Valuation Report for This Property
The Home Valuation Report is an in-depth analysis detailing your home's value as well as a comparison with similar homes in the area
Home Values in the Area
Average Home Value in this Area
Purchase History
| Date | Buyer | Sale Price | Title Company |
|---|---|---|---|
| Barabas Janet | $140,000 | Revere Title | |
| Wonnell Jan | $165,500 | Gateway Title Agency Inc | |
| Kraiger Fred | -- | -- | |
| Kraiger Fred | $84,000 | -- | |
| Dinallo & Wittrup Homes Inc | $21,000 | -- | |
| D C Winslow Construction Co | -- | -- | |
| Sunrise Dev Co | $72,100 | -- | |
| Solon Dev Co | -- | -- |
Source: Public Records
Mortgage History
| Date | Status | Borrower | Loan Amount |
|---|---|---|---|
| Previous Owner | Wonnell Jan | $115,500 |
Source: Public Records
Tax History
| Year | Tax Paid | Tax Assessment Tax Assessment Total Assessment is a certain percentage of the fair market value that is determined by local assessors to be the total taxable value of land and additions on the property. | Land | Improvement |
|---|---|---|---|---|
| 2024 | $4,296 | $88,305 | $22,015 | $66,290 |
| 2023 | $3,649 | $63,710 | $19,290 | $44,420 |
| 2022 | $3,669 | $63,700 | $19,290 | $44,420 |
| 2021 | $3,628 | $63,700 | $19,290 | $44,420 |
| 2020 | $3,264 | $53,970 | $16,350 | $37,630 |
| 2019 | $3,161 | $154,200 | $46,700 | $107,500 |
| 2018 | $2,831 | $53,970 | $16,350 | $37,630 |
| 2017 | $2,658 | $48,900 | $15,720 | $33,180 |
| 2016 | $2,633 | $48,900 | $15,720 | $33,180 |
| 2015 | $2,570 | $48,900 | $15,720 | $33,180 |
| 2014 | $2,570 | $46,550 | $14,980 | $31,570 |
Source: Public Records
Map
Nearby Homes
- 32623 Jefferson Dr Unit 23
- 32936 N Roundhead Dr
- 32985 Charmwood Oval
- 33014 N Roundhead Dr
- 6902 Kingswood Dr
- 33071 N Burr Oak Dr
- 32443 S Burr Oak Dr
- 7471 Som Center Rd
- 6728 Edgemoor Ave
- 35160 Spatterdock Ln
- 33771 Canterbury Rd
- 33346 Lisa Ln
- 10397 W Cobblestone Ln
- 6531 Arbordale Ave
- 10424 Oviatt Ln
- 10240 Orchard Hill Ln Unit I23
- 7268 Annadale Dr
- V/L (1.32 Acres) Aurora Rd
- 32801 Baldwin Rd
- 10273 Luman Ln
- 32711 N Roundhead Dr
- 32631 N Roundhead Dr
- 32745 N Roundhead Dr
- 32591 N Roundhead Dr
- 32785 N Roundhead Dr
- 32664 N Roundhead Dr
- 32704 N Roundhead Dr
- 32624 N Roundhead Dr
- 32742 N Roundhead Dr
- 32825 N Roundhead Dr
- 32513 N Roundhead Dr
- 32782 N Roundhead Dr
- 32584 N Roundhead Dr
- 32475 N Roundhead Dr
- 32647 Jefferson Dr Unit 47
- 32645 Jefferson Dr Unit 45
- 32649 Jefferson Dr Unit 49
- 32643 Jefferson Dr
- 32643 Jefferson Dr Unit 43
- 32820 N Roundhead Dr
Your Personal Tour Guide
Ask me questions while you tour the home.