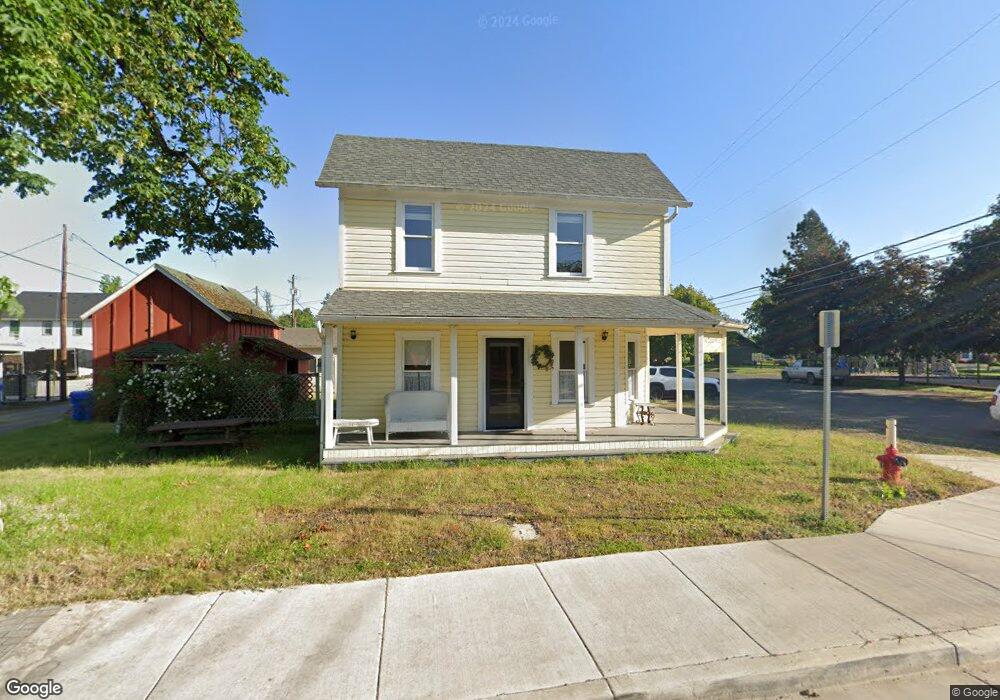
32677 E Mckenzie St Eugene, OR 97408
Coburg NeighborhoodEstimated Value: $512,230
Studio
--
Bath
1,576
Sq Ft
$325/Sq Ft
Est. Value
About This Home
This home is located at 32677 E Mckenzie St, Eugene, OR 97408 and is currently estimated at $512,230, approximately $325 per square foot. 32677 E Mckenzie St is a home located in Lane County with nearby schools including Gilham Elementary School, Cal Young Middle School, and Sheldon High School.
Ownership History
Date
Name
Owned For
Owner Type
Purchase Details
Closed on
Sep 6, 2016
Sold by
Jones Michael D and Jones Monique C
Bought by
Moore Bruce and Owen Michelle Ann
Current Estimated Value
Home Financials for this Owner
Home Financials are based on the most recent Mortgage that was taken out on this home.
Original Mortgage
$200,000
Outstanding Balance
$19,405
Interest Rate
3.43%
Mortgage Type
Commercial
Estimated Equity
$492,825
Purchase Details
Closed on
Jun 12, 2006
Sold by
Wilson Daniel E and Wilson Kristine S
Bought by
Jones Michael D and Jones Monique C
Purchase Details
Closed on
May 31, 2006
Sold by
Wilson Daniel E and Wilson Kristine S
Bought by
Jones Michael D and Jones Monique C
Purchase Details
Closed on
Mar 23, 1998
Sold by
Lomsky Mikel R and Lomsky Rhoda Lee
Bought by
Wilson Daniel E and Wilson Kristine S
Create a Home Valuation Report for This Property
The Home Valuation Report is an in-depth analysis detailing your home's value as well as a comparison with similar homes in the area
Home Values in the Area
Average Home Value in this Area
Purchase History
| Date | Buyer | Sale Price | Title Company |
|---|---|---|---|
| Moore Bruce | $275,000 | Evergreen Land Title Company | |
| Jones Michael D | -- | Pacific Northwest Title Of L | |
| Jones Michael D | $299,000 | Pacific Northwest Title Of L | |
| Wilson Daniel E | $95,000 | Title Guaranty Co |
Source: Public Records
Mortgage History
| Date | Status | Borrower | Loan Amount |
|---|---|---|---|
| Open | Moore Bruce | $200,000 |
Source: Public Records
Tax History
| Year | Tax Paid | Tax Assessment Tax Assessment Total Assessment is a certain percentage of the fair market value that is determined by local assessors to be the total taxable value of land and additions on the property. | Land | Improvement |
|---|---|---|---|---|
| 2025 | $3,333 | $201,575 | -- | -- |
| 2024 | $3,297 | $195,704 | -- | -- |
| 2023 | $3,297 | $190,004 | $0 | $0 |
| 2022 | $4,067 | $252,171 | $0 | $0 |
| 2021 | $3,810 | $244,826 | $0 | $0 |
| 2020 | $4,468 | $292,000 | $0 | $0 |
| 2019 | $3,821 | $230,772 | $0 | $0 |
| 2018 | $3,585 | $217,525 | $0 | $0 |
| 2017 | $3,442 | $217,525 | $0 | $0 |
| 2016 | $3,344 | $211,189 | $0 | $0 |
| 2015 | $3,263 | $205,038 | $0 | $0 |
| 2014 | $3,118 | $199,066 | $0 | $0 |
Source: Public Records
Map
Nearby Homes
- 32633 W Mckenzie St
- 91033 Water St
- 91213 N Harrison St
- 91184 N Miller St
- 91247 N Willamette St
- 91153 N Miller St
- 0 Diamond Ridge Loop Unit 712962163
- 91298 Oak Crest Rd
- 33723 van Duyn Rd
- 00 Coburg Rd
- 3950 Coburg Rd Unit 52
- 90849 Coburghills Dr
- 90834 Coburghills Dr
- 2138 Country Haven Dr
- 1923 Sterling Park Place
- 3858 Mirror Pond Way
- 3689 Marcella Dr
- 3708 Gilham Rd
- 3620 Walton Ln
- 3770 Waterbrook Way
- 91114 N Harrison St
- 32671 E Mckenzie St
- 32619 E Mckenzie St
- 91109 N Willamette St
- 91115 N Willamette St
- 32670 E Mill St
- 32676 E Mill St
- 91108 N Willamette St
- 32671 E Mill St
- 91086 N Willamette St
- 1964 Bungalow Crossing Ln
- 32712 E Mckenzie St
- 32713 E Mckenzie St
- 91124 N Willamette St
- 91125 N Diamond St
- 91074 N Willamette St
- 91136 N Harrison St
- 91131 N Diamond St
- 32641 W Mckenzie St
- 91088 N Skinner St
Your Personal Tour Guide
Ask me questions while you tour the home.