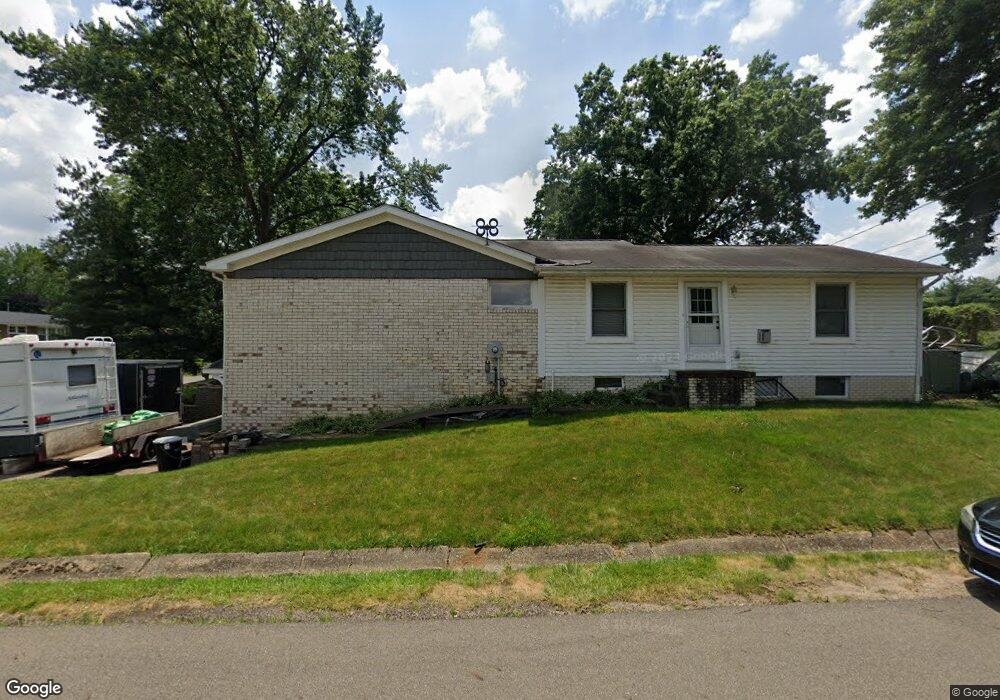
3269 Bahama Ave NW Massillon, OH 44646
Amherst Heights-Clearview NeighborhoodEstimated Value: $238,000 - $310,000
6
Beds
3
Baths
2,430
Sq Ft
$118/Sq Ft
Est. Value
About This Home
This home is located at 3269 Bahama Ave NW, Massillon, OH 44646 and is currently estimated at $286,051, approximately $117 per square foot. 3269 Bahama Ave NW is a home located in Stark County with nearby schools including Amherst Elementary School, Jackson Memorial Middle School, and Jackson High School.
Ownership History
Date
Name
Owned For
Owner Type
Purchase Details
Closed on
Apr 10, 2015
Sold by
Williams David A and Fleming Darlene K
Bought by
Williams David A and Fleming Darlene K
Current Estimated Value
Purchase Details
Closed on
Nov 18, 2009
Sold by
Burdeshaw Patricia L
Bought by
Williams David A
Home Financials for this Owner
Home Financials are based on the most recent Mortgage that was taken out on this home.
Original Mortgage
$108,007
Outstanding Balance
$70,163
Interest Rate
4.9%
Mortgage Type
FHA
Estimated Equity
$215,888
Purchase Details
Closed on
May 13, 2005
Sold by
Burdeshaw Jon K
Bought by
Burdeshaw Patricia L
Home Financials for this Owner
Home Financials are based on the most recent Mortgage that was taken out on this home.
Original Mortgage
$184,000
Interest Rate
7.45%
Mortgage Type
Purchase Money Mortgage
Purchase Details
Closed on
Jan 12, 1995
Sold by
Ehmer Robin R
Bought by
Burdeshaw Jon K and Burdeshaw Patricia
Home Financials for this Owner
Home Financials are based on the most recent Mortgage that was taken out on this home.
Original Mortgage
$79,796
Interest Rate
9.23%
Mortgage Type
New Conventional
Purchase Details
Closed on
Aug 2, 1989
Create a Home Valuation Report for This Property
The Home Valuation Report is an in-depth analysis detailing your home's value as well as a comparison with similar homes in the area
Home Values in the Area
Average Home Value in this Area
Purchase History
| Date | Buyer | Sale Price | Title Company |
|---|---|---|---|
| Williams David A | -- | Timios Inc | |
| Williams David A | $110,000 | Netwide Title Agency Inc | |
| Burdeshaw Patricia L | -- | -- | |
| Burdeshaw Jon K | $86,500 | -- | |
| -- | $72,500 | -- |
Source: Public Records
Mortgage History
| Date | Status | Borrower | Loan Amount |
|---|---|---|---|
| Open | Williams David A | $108,007 | |
| Previous Owner | Burdeshaw Patricia L | $184,000 | |
| Previous Owner | Burdeshaw Jon K | $79,796 |
Source: Public Records
Tax History Compared to Growth
Tax History
| Year | Tax Paid | Tax Assessment Tax Assessment Total Assessment is a certain percentage of the fair market value that is determined by local assessors to be the total taxable value of land and additions on the property. | Land | Improvement |
|---|---|---|---|---|
| 2025 | -- | $99,300 | $17,540 | $81,760 |
| 2024 | -- | $99,300 | $17,540 | $81,760 |
| 2023 | $3,571 | $70,220 | $12,360 | $57,860 |
| 2022 | $3,556 | $70,220 | $12,360 | $57,860 |
| 2021 | $3,570 | $70,220 | $12,360 | $57,860 |
| 2020 | $3,047 | $55,100 | $10,260 | $44,840 |
| 2019 | $2,946 | $55,100 | $10,260 | $44,840 |
| 2018 | $2,964 | $55,100 | $10,260 | $44,840 |
| 2017 | $2,911 | $51,460 | $8,050 | $43,410 |
| 2016 | $2,930 | $51,460 | $8,050 | $43,410 |
| 2015 | $2,966 | $51,460 | $8,050 | $43,410 |
| 2014 | $659 | $44,080 | $6,900 | $37,180 |
| 2013 | $1,325 | $44,570 | $6,900 | $37,670 |
Source: Public Records
Map
Nearby Homes
- 2866 Carie Hill Cir NW
- 7841 Tahiti St NW
- 3410 Wales Ave NW
- 7942 Loriwood Cir NW
- 7604 Greenview Ave NW
- 3252 Stahl Ave NW
- 0 Wildridge Rd NW Unit 36853475
- 3536 Oxford Ave NW
- 3315 Broadhaven Ave NW
- 7770 Hills And Dales Rd NW
- 1204 Taggart St NW
- 3511 Marys Way Ave NW
- 3587 Marys Way Ave NW
- 3944 Columbia Ave NW
- Lot 38 Joyce Ave NW
- 1056 Taggart St NW
- 3533 Joyce Ave NW
- 3517 Joyce Ave NW
- 3545 Joyce Ave NW
- 3579 Joyce Ave NW
- 3266 Hewitt Ave NW
- 3295 Bahama Ave NW
- 3252 Hewitt Ave NW
- 3250 Hewitt Ave NW
- 3280 Bahama Ave NW
- 3233 Bahama Ave NW
- 7931 Tarpon St NW
- 3298 Bahama Ave NW
- 3311 Bahama Ave NW
- 3230 Hewitt Ave NW
- 3228 Bahama Ave NW
- 7951 Tarpon St NW
- 3316 Bahama Ave NW
- 3261 Catalina Ave NW
- 3277 Catalina Ave NW
- 3267 Hewitt Ave NW
- 3295 Catalina Ave NW
- 3199 Carie Hill Cir NW
- 3251 Hewitt Ave NW
- 7900 Daytona St NW