A
Seller's Agent in 2024
Angela Carman
RE/MAX
(515) 202-3659
1 in this area
35 Total Sales

Estimated Value: $186,000 - $216,289
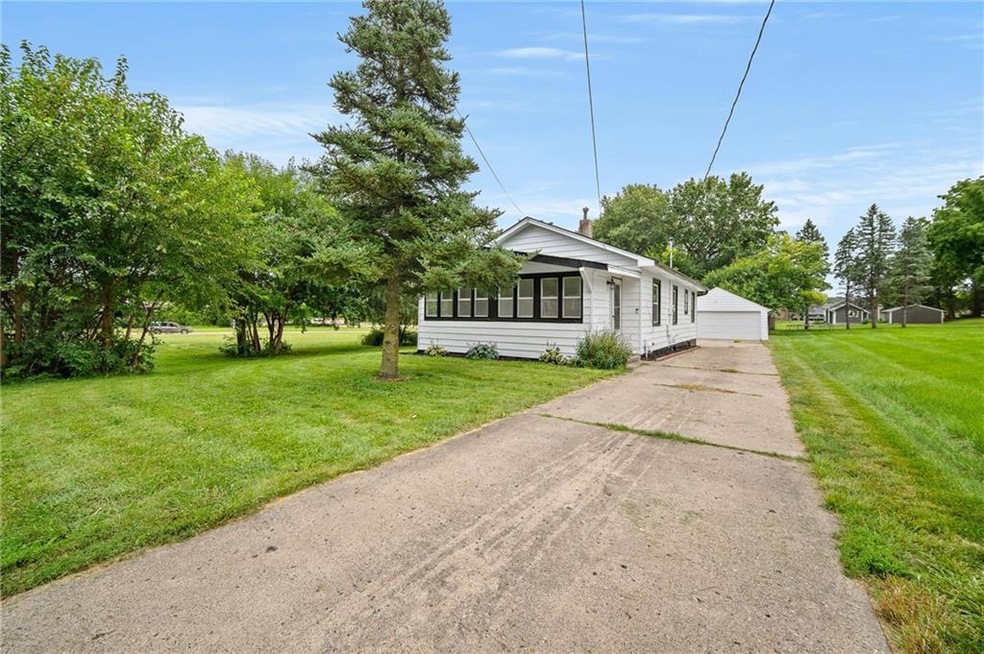
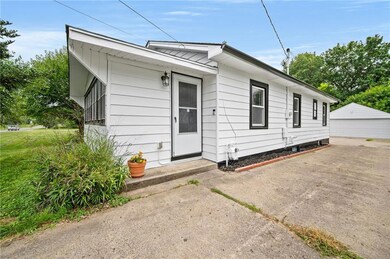
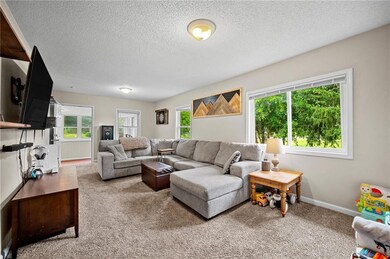
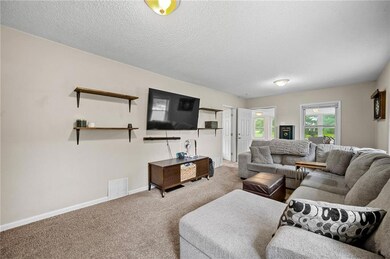
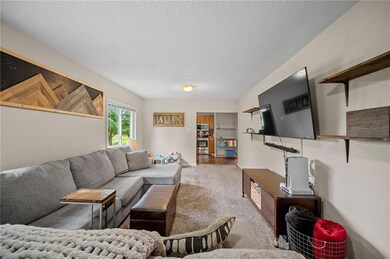
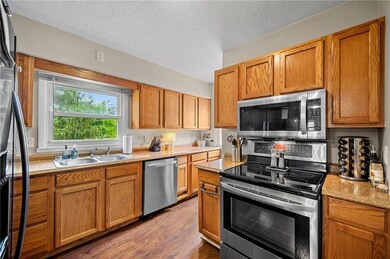
Step into this charming single-family home located in the heart of Des Moines. This beautifully maintained 2 bedroom, 1 bathroom home features a front enclosed porch to enjoy your morning coffee, a large master bedroom with an ensuite bath, stainless steel appliances that are only a couple years old, vinyl windows, white trim, white 6 paneled doors, a large main living space, and a dry, open basement ready to be finished. Enjoy a oversized 2 car garage with an additional work space. This is the perfect space for a handyman, mechanic, or man cave. This home is nestled on a double lot, which is almost an acre of land. Unwind with the fire pit, which gives you the country feel in the city. New Roof and Gutters in June 2024. Home also has an additional boat/camper/trailer parking in driveway. Located on the Northeast side close to restaurants, park, schools, and shopping. Don?t miss out on this wonderful opportunity to make this house your home. Schedule a showing today and experience all that 3269 E. Douglas Ave. has to offer. All information obtained from seller and public records.
We collect this data history from publicly available records. To have your information removed, we recommend requesting removal directly through your county’s website.
We collect this data history from publicly available records. To have your information removed, we recommend requesting removal directly through your county’s website.
| Date | Buyer | Sale Price | Title Company |
|---|---|---|---|
| $215,000 | None Listed On Document | ||
| $215,000 | None Listed On Document | ||
| $119,000 | None Available | ||
| -- | None Available | ||
| -- | None Available | ||
| $76,429 | None Available | ||
| $64,500 | None Available | ||
| $57,800 | None Available | ||
| $94,500 | -- | ||
| -- | -- |
We collect this data history from publicly available records. To have your information removed, we recommend requesting removal directly through your county’s website.
| Date | Status | Borrower | Loan Amount |
|---|---|---|---|
| Open | $10,745 | ||
| Closed | $10,745 | ||
| Open | $208,453 | ||
| Closed | $208,453 | ||
| Previous Owner | $116,844 | ||
| Previous Owner | $63,331 | ||
| Previous Owner | $75,000 |
We collect this data history from publicly available records. To have your information removed, we recommend requesting removal directly through your county’s website.
| Date | Event | Price | List to Sale | Price per Sq Ft | Prior Sale |
|---|---|---|---|---|---|
| 12/02/2024 12/02/24 | Sold | $214,900 | 0.0% | $236 / Sq Ft | |
| 10/02/2024 10/02/24 | Pending | -- | -- | -- | |
| 09/12/2024 09/12/24 | Price Changed | $214,900 | -2.3% | $236 / Sq Ft | |
| 09/05/2024 09/05/24 | Price Changed | $219,900 | -4.3% | $241 / Sq Ft | |
| 08/26/2024 08/26/24 | Price Changed | $229,900 | -2.2% | $252 / Sq Ft | |
| 08/14/2024 08/14/24 | For Sale | $235,000 | +97.5% | $258 / Sq Ft | |
| 09/17/2018 09/17/18 | Sold | $119,000 | -8.4% | $130 / Sq Ft | View Prior Sale |
| 09/17/2018 09/17/18 | Pending | -- | -- | -- | |
| 07/11/2018 07/11/18 | For Sale | $129,900 | +99.5% | $142 / Sq Ft | |
| 09/25/2016 09/25/16 | Pending | -- | -- | -- | |
| 09/08/2016 09/08/16 | Sold | $65,100 | +8.5% | $71 / Sq Ft | View Prior Sale |
| 08/12/2016 08/12/16 | For Sale | $60,000 | -7.0% | $66 / Sq Ft | |
| 08/13/2014 08/13/14 | Sold | $64,500 | -0.6% | $71 / Sq Ft | View Prior Sale |
| 07/28/2014 07/28/14 | Pending | -- | -- | -- | |
| 06/17/2014 06/17/14 | For Sale | $64,900 | -- | $71 / Sq Ft |
We collect this data history from publicly available records. To have your information removed, we recommend requesting removal directly through your county’s website.
| Year | Tax Paid | Tax Assessment Tax Assessment Total Assessment is a certain percentage of the fair market value that is determined by local assessors to be the total taxable value of land and additions on the property. | Land | Improvement |
|---|---|---|---|---|
| 2025 | $2,948 | $172,400 | $42,900 | $129,500 |
| 2024 | $2,948 | $149,900 | $31,000 | $118,900 |
| 2023 | $2,976 | $149,900 | $31,000 | $118,900 |
| 2022 | $2,954 | $126,300 | $27,300 | $99,000 |
| 2021 | $2,874 | $126,300 | $27,300 | $99,000 |
| 2020 | $2,986 | $115,200 | $25,100 | $90,100 |
| 2019 | $2,408 | $115,200 | $25,100 | $90,100 |
| 2018 | $2,384 | $89,600 | $21,400 | $68,200 |
| 2017 | $2,216 | $89,600 | $21,400 | $68,200 |
| 2016 | $2,087 | $81,900 | $19,400 | $62,500 |
| 2015 | $1,928 | $81,900 | $19,400 | $62,500 |
| 2014 | $2,004 | $75,400 | $17,800 | $57,600 |
A
Seller's Agent in 2024
Angela Carman
RE/MAX
(515) 202-3659
1 in this area
35 Total Sales

Seller Co-Listing Agent in 2024
Angela Meek
RE/MAX
(515) 577-7729
1 in this area
217 Total Sales
J
Buyer's Agent in 2024
Jordan DeLara
Rude Realty
(847) 770-8302
1 in this area
53 Total Sales
B
Seller's Agent in 2018
Bob Cazavilan
United Real Estate Profess
Buyer's Agent in 2018
Jeffrey Horner
Gillum Group Real Estate LLC
(515) 619-8592
1 in this area
99 Total Sales
Seller's Agent in 2016
Steven Camerona
Iowa Realty Beaverdale
(515) 277-6211
3 in this area
233 Total Sales
Source: Des Moines Area Association of REALTORS®
MLS Number: 700966
APN: 060-01809000000
Disclaimer: Certain information contained herein is derived from information provided by parties other than Homes.com. All information provided is deemed reliable, but is not guaranteed to be accurate and should be independently verified.
![]() IDX information is provided exclusively for personal, non-commercial use, and may not be used for any purpose other than to identify prospective properties consumers may be interested in purchasing. Information is deemed reliable but not guaranteed.
IDX information is provided exclusively for personal, non-commercial use, and may not be used for any purpose other than to identify prospective properties consumers may be interested in purchasing. Information is deemed reliable but not guaranteed.
Ask me questions while you tour the home.