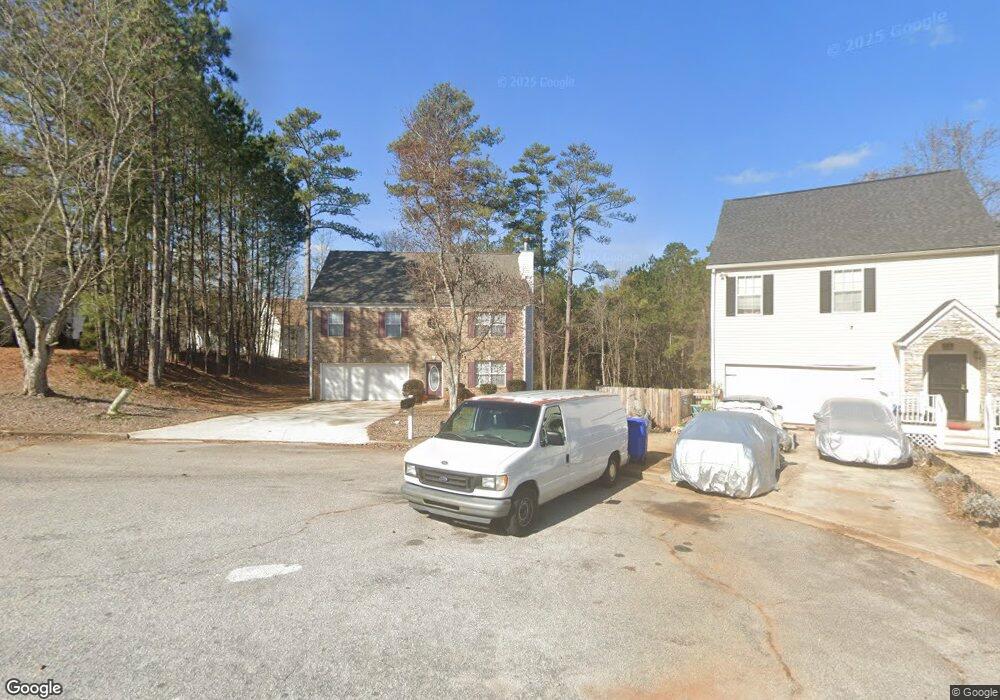
3269 Forrest Bluff Ct Lithonia, GA 30038
Estimated Value: $259,000 - $342,000
6
Beds
4
Baths
2,560
Sq Ft
$118/Sq Ft
Est. Value
About This Home
This home is located at 3269 Forrest Bluff Ct, Lithonia, GA 30038 and is currently estimated at $303,062, approximately $118 per square foot. 3269 Forrest Bluff Ct is a home located in DeKalb County with nearby schools including Browns Mill Elementary School, Salem Middle School, and Martin Luther King- Jr. High School.
Ownership History
Date
Name
Owned For
Owner Type
Purchase Details
Closed on
May 22, 2009
Sold by
Cit Mtg Ln Trust 2007-1
Bought by
Bartley Karlene
Current Estimated Value
Home Financials for this Owner
Home Financials are based on the most recent Mortgage that was taken out on this home.
Original Mortgage
$67,500
Outstanding Balance
$42,533
Interest Rate
4.8%
Mortgage Type
New Conventional
Estimated Equity
$260,529
Purchase Details
Closed on
Dec 2, 2008
Sold by
Derese Argaw
Bought by
Cit Grp Of Consumer Fin Inc
Purchase Details
Closed on
Sep 15, 2000
Sold by
Forrest Homes Inc
Bought by
Gizaw Meron
Home Financials for this Owner
Home Financials are based on the most recent Mortgage that was taken out on this home.
Original Mortgage
$166,000
Interest Rate
7.92%
Mortgage Type
FHA
Create a Home Valuation Report for This Property
The Home Valuation Report is an in-depth analysis detailing your home's value as well as a comparison with similar homes in the area
Home Values in the Area
Average Home Value in this Area
Purchase History
| Date | Buyer | Sale Price | Title Company |
|---|---|---|---|
| Bartley Karlene | -- | -- | |
| Cit Grp Of Consumer Fin Inc | $81,571 | -- | |
| Gizaw Meron | $166,300 | -- |
Source: Public Records
Mortgage History
| Date | Status | Borrower | Loan Amount |
|---|---|---|---|
| Open | Bartley Karlene | $67,500 | |
| Previous Owner | Gizaw Meron | $166,000 |
Source: Public Records
Tax History Compared to Growth
Tax History
| Year | Tax Paid | Tax Assessment Tax Assessment Total Assessment is a certain percentage of the fair market value that is determined by local assessors to be the total taxable value of land and additions on the property. | Land | Improvement |
|---|---|---|---|---|
| 2025 | $6,022 | $125,280 | $20,000 | $105,280 |
| 2024 | $6,306 | $132,520 | $20,000 | $112,520 |
| 2023 | $6,306 | $116,600 | $7,000 | $109,600 |
| 2022 | $5,214 | $111,520 | $7,000 | $104,520 |
| 2021 | $4,005 | $82,720 | $7,000 | $75,720 |
| 2020 | $3,203 | $65,400 | $7,000 | $58,400 |
| 2019 | $3,029 | $61,880 | $7,000 | $54,880 |
| 2018 | $2,626 | $56,200 | $7,000 | $49,200 |
| 2017 | $2,600 | $51,880 | $7,000 | $44,880 |
| 2016 | $2,501 | $49,520 | $7,000 | $42,520 |
| 2014 | $1,677 | $30,120 | $6,960 | $23,160 |
Source: Public Records
Map
Nearby Homes
- 3267 Forrest Bluff Way
- 5058 Rock Springs Rd
- 3202 Herrenhut Rd
- 4995 Panola Mill Dr
- 4992 Needle Knob Ct
- 5057 Panola Mill Dr
- 3262 Moravia Dr
- 3352 Herrenhut Rd
- 3094 Oxbridge Way
- 3333 Saxony Way
- 4923 Panola Mill Dr
- 5074 Great Meadows Rd
- 3468 Deer Trace
- 4922 Rock Springs Rd
- 4910 Thompson Mill Rd
- 3272 Corktree Trail
- 3605 Portsmouth Cir
- 4715 Wildginger Run
- 3309 Panola Rd
- 3235 Wintercreeper Dr
- 3262 Forrest Bluff Ct
- 3275 Forrest Bluff Ct
- 3266 Forrest Bluff Way
- 3272 Forrest Bluff Way
- 3260 Forrest Bluff Way
- 4942 Forrest Run
- 3268 Forrest Bluff Ct
- 4923 Forrest Run
- 4933 Forrest Run
- 3273 Forrest Bluff Way
- 4960 Forrest Run
- 4913 Forrest Run
- 4943 Forrest Run
- 4902 Forrest Run
- 4953 Forrest Run
- 3254 Forrest Bluff Way
- 4903 Forrest Run
- 3261 Forrest Bluff Way
- 3255 Forrest Bluff Way
- 4892 Forrest Run