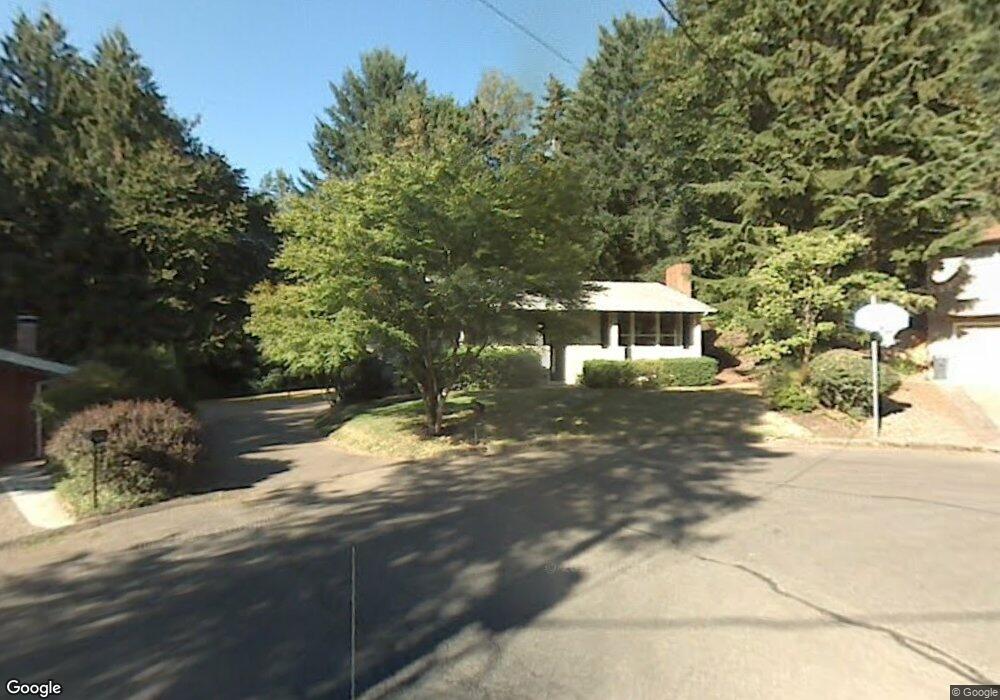
3269 Phyllis Ct Lake Oswego, OR 97035
Uplands NeighborhoodEstimated Value: $724,000 - $941,000
3
Beds
3
Baths
1,711
Sq Ft
$471/Sq Ft
Est. Value
About This Home
This home is located at 3269 Phyllis Ct, Lake Oswego, OR 97035 and is currently estimated at $805,293, approximately $470 per square foot. 3269 Phyllis Ct is a home located in Clackamas County with nearby schools including Forest Hills Elementary School, Lake Oswego Junior High School, and Lake Oswego Senior High School.
Ownership History
Date
Name
Owned For
Owner Type
Purchase Details
Closed on
Mar 20, 2013
Sold by
Oneill Margaret Mary and Gallagher Margaret
Bought by
Robles Jose Freddy and Robles Jennifer M
Current Estimated Value
Home Financials for this Owner
Home Financials are based on the most recent Mortgage that was taken out on this home.
Original Mortgage
$345,982
Outstanding Balance
$242,753
Interest Rate
3.49%
Mortgage Type
VA
Estimated Equity
$562,540
Purchase Details
Closed on
Nov 28, 2005
Sold by
Gallagher William
Bought by
Gallagher Margaret
Create a Home Valuation Report for This Property
The Home Valuation Report is an in-depth analysis detailing your home's value as well as a comparison with similar homes in the area
Home Values in the Area
Average Home Value in this Area
Purchase History
| Date | Buyer | Sale Price | Title Company |
|---|---|---|---|
| Robles Jose Freddy | $338,700 | Ticor Title | |
| Gallagher Margaret | -- | -- |
Source: Public Records
Mortgage History
| Date | Status | Borrower | Loan Amount |
|---|---|---|---|
| Open | Robles Jose Freddy | $345,982 |
Source: Public Records
Tax History Compared to Growth
Tax History
| Year | Tax Paid | Tax Assessment Tax Assessment Total Assessment is a certain percentage of the fair market value that is determined by local assessors to be the total taxable value of land and additions on the property. | Land | Improvement |
|---|---|---|---|---|
| 2025 | $5,544 | $288,677 | -- | -- |
| 2024 | $5,396 | $280,269 | -- | -- |
| 2023 | $5,396 | $272,106 | $0 | $0 |
| 2022 | $5,082 | $264,181 | $0 | $0 |
| 2021 | $4,694 | $256,487 | $0 | $0 |
| 2020 | $4,576 | $249,017 | $0 | $0 |
| 2019 | $4,463 | $241,765 | $0 | $0 |
| 2018 | $4,245 | $234,723 | $0 | $0 |
| 2017 | $4,096 | $227,886 | $0 | $0 |
| 2016 | $3,729 | $221,249 | $0 | $0 |
| 2015 | $3,602 | $214,805 | $0 | $0 |
| 2014 | $3,556 | $208,549 | $0 | $0 |
Source: Public Records
Map
Nearby Homes
- 2 Falstaff St
- 50 Touchstone
- 16 Othello St
- 2703 Glen Eagles Rd
- 3853 Carman Dr
- 2560 Glen Eagles Place
- 15370 Twin Fir Rd
- 10 Mountain Cir
- 3 Mountain Cir
- 64 Wheatherstone Ct Unit 36
- 3990 Carman Dr
- 90 Wheatherstone Place
- 4 Touchstone Unit 136
- 4 Touchstone Unit 138
- 4 Touchstone Unit 141
- 3816 Botticelli
- 100 Kerr Pkwy Unit 30
- 100 Kerr Pkwy Unit 19
- 3814 Botticelli St
- 2217 Prestwick Rd
- 3241 Phyllis Ct
- 3275 Phyllis Ct
- 14485 Rainbow Dr
- 3190 Rainbow Dr
- 14527 Rainbow Dr
- 3240 Phyllis Ct
- 3270 Phyllis Ct
- 14627 Rainbow Dr
- 3252 Phyllis Ct
- 14520 Rainbow Dr
- 14542 Rainbow Dr
- 14731 Rainbow Dr
- 14536 Rainbow Dr
- 14584 Rainbow Dr
- 3122 Diane Dr
- 64 Touchstone
- 62 Touchstone
- 14727 Rainbow Dr
- 66 Touchstone
- 14664 Rainbow Dr