D
Seller's Agent in 2019
Derek Dickson
OfferPad Brokerage, LLC
Estimated Value: $717,000 - $761,000
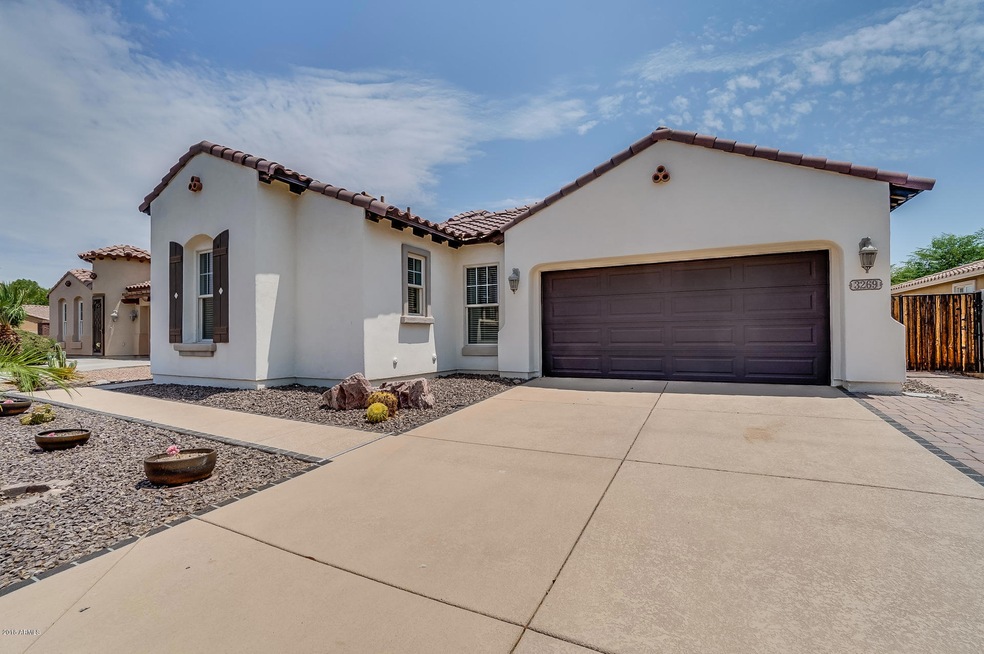
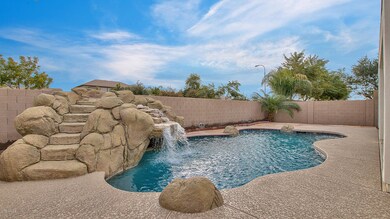
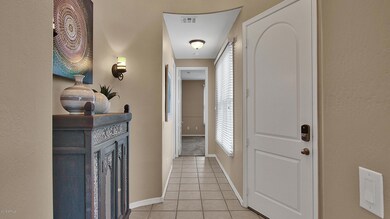
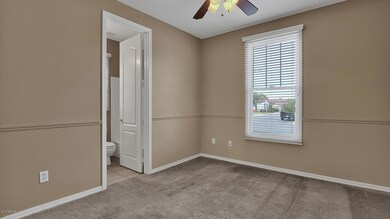
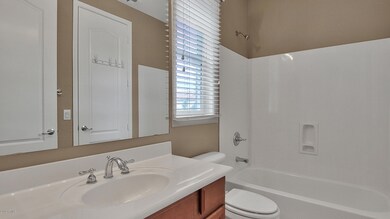
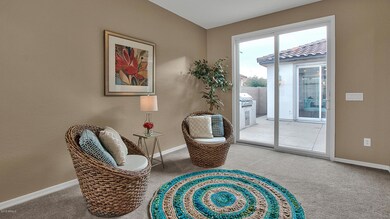
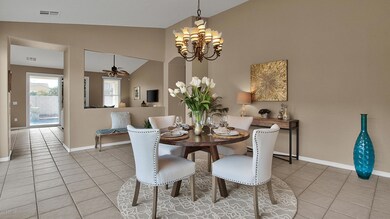
Beautiful South Chandler single level home featuring 4BRs/3BA plus a pool with slide! All new two-tone interior paint throughout. Entry opens with neutral tile in the main areas and carpet in the bedrooms. Split floor plan with 2 guest rooms at the front of the house connected by a jack N jill bathroom. Open den and separate dining room. Eat-in kitchen boasts a large center island with granite counters and stainless steel appliances, including a new dishwasher. The Master bedroom offers a separate exit to the backyard, large ensuite with dual sinks and separate shower/soaking tub. Side courtyard with built in BBQ and the backyard features covered patio with extended flagstone and pool with rock feature. Don't miss out on seeing this one!
Last Agent to Sell the Property
OfferPad Brokerage, LLC License #SA639968000 Listed on: 08/06/2018
| Date | Buyer | Sale Price | Title Company |
|---|---|---|---|
| Mei Andy Lie | $408,000 | First American Title Insuran | |
| Offerpad Spvborrower Llc | $396,265 | First American Title Insuran | |
| Charania Equbalali | -- | None Available | |
| Charania Equbalali | -- | None Available | |
| Charania Equbalali | -- | None Available | |
| Charania Equbalali | -- | Empire West Title Agency | |
| Charania Equbalali | $249,900 | Empire West Title Agency | |
| Burns Charles | -- | Chicago Title Insurance Co | |
| Burns Charles | $282,941 | Chicago Title Insurance Co |
| Date | Status | Borrower | Loan Amount |
|---|---|---|---|
| Open | Mei Andy Lie | $326,400 | |
| Previous Owner | Charania Equbalali | $238,000 | |
| Previous Owner | Charania Equbalali | $237,405 | |
| Previous Owner | Burns Charles | $268,793 |
| Date | Event | Price | List to Sale | Price per Sq Ft | Prior Sale |
|---|---|---|---|---|---|
| 02/14/2019 02/14/19 | Sold | $408,000 | -1.6% | $161 / Sq Ft | |
| 01/11/2019 01/11/19 | Pending | -- | -- | -- | |
| 12/11/2018 12/11/18 | Price Changed | $414,800 | 0.0% | $164 / Sq Ft | |
| 12/06/2018 12/06/18 | Price Changed | $414,900 | -0.6% | $164 / Sq Ft | |
| 11/11/2018 11/11/18 | Price Changed | $417,500 | -0.6% | $165 / Sq Ft | |
| 09/11/2018 09/11/18 | For Sale | $419,900 | 0.0% | $166 / Sq Ft | |
| 08/27/2018 08/27/18 | Pending | -- | -- | -- | |
| 08/06/2018 08/06/18 | For Sale | $419,900 | +68.0% | $166 / Sq Ft | |
| 02/23/2012 02/23/12 | Sold | $249,900 | +2.0% | $99 / Sq Ft | View Prior Sale |
| 02/03/2012 02/03/12 | For Sale | $245,000 | 0.0% | $97 / Sq Ft | |
| 12/20/2011 12/20/11 | Pending | -- | -- | -- | |
| 12/16/2011 12/16/11 | Price Changed | $245,000 | -1.6% | $97 / Sq Ft | |
| 12/07/2011 12/07/11 | For Sale | $249,000 | 0.0% | $98 / Sq Ft | |
| 12/07/2011 12/07/11 | Price Changed | $249,000 | +1.6% | $98 / Sq Ft | |
| 12/01/2011 12/01/11 | Pending | -- | -- | -- | |
| 11/28/2011 11/28/11 | For Sale | $245,000 | 0.0% | $97 / Sq Ft | |
| 09/29/2011 09/29/11 | Pending | -- | -- | -- | |
| 07/12/2011 07/12/11 | For Sale | $245,000 | 0.0% | $97 / Sq Ft | |
| 07/12/2011 07/12/11 | Price Changed | $245,000 | +4.3% | $97 / Sq Ft | |
| 07/05/2011 07/05/11 | For Sale | $235,000 | 0.0% | $93 / Sq Ft | |
| 07/05/2011 07/05/11 | Price Changed | $235,000 | 0.0% | $93 / Sq Ft | |
| 04/18/2011 04/18/11 | Pending | -- | -- | -- | |
| 04/11/2011 04/11/11 | Price Changed | $235,000 | -4.1% | $93 / Sq Ft | |
| 03/24/2011 03/24/11 | Price Changed | $245,000 | +7.0% | $97 / Sq Ft | |
| 03/14/2011 03/14/11 | Price Changed | $229,000 | -8.0% | $90 / Sq Ft | |
| 03/04/2011 03/04/11 | For Sale | $249,000 | 0.0% | $98 / Sq Ft | |
| 02/18/2011 02/18/11 | Pending | -- | -- | -- | |
| 02/15/2011 02/15/11 | For Sale | $249,000 | -- | $98 / Sq Ft |
| Year | Tax Paid | Tax Assessment Tax Assessment Total Assessment is a certain percentage of the fair market value that is determined by local assessors to be the total taxable value of land and additions on the property. | Land | Improvement |
|---|---|---|---|---|
| 2025 | $3,213 | $40,412 | -- | -- |
| 2024 | $3,081 | $38,488 | -- | -- |
| 2023 | $3,081 | $55,210 | $11,040 | $44,170 |
| 2022 | $2,968 | $40,710 | $8,140 | $32,570 |
| 2021 | $3,103 | $38,210 | $7,640 | $30,570 |
| 2020 | $3,088 | $36,170 | $7,230 | $28,940 |
| 2019 | $2,971 | $33,800 | $6,760 | $27,040 |
| 2018 | $2,876 | $31,950 | $6,390 | $25,560 |
| 2017 | $2,682 | $30,460 | $6,090 | $24,370 |
| 2016 | $2,571 | $30,020 | $6,000 | $24,020 |
| 2015 | $2,501 | $28,810 | $5,760 | $23,050 |
D
Seller's Agent in 2019
Derek Dickson
OfferPad Brokerage, LLC

Buyer's Agent in 2019
Nancy Gee
Realty One Group
(480) 319-4806
22 Total Sales
M
Seller's Agent in 2012
Mark Ketring
AZ Key LLC
(480) 336-3536
1 Total Sale
Buyer's Agent in 2012
Ryan Rosscup
Realty One Group
(602) 301-9667
5 in this area
79 Total Sales
Source: Arizona Regional Multiple Listing Service (ARMLS)
MLS Number: 5803039
APN: 303-43-339
Disclaimer: Certain information contained herein is derived from information provided by parties other than Homes.com. All information provided is deemed reliable, but is not guaranteed to be accurate and should be independently verified.
![]() All information should be verified by the recipient and none is guaranteed as accurate by ARMLS
All information should be verified by the recipient and none is guaranteed as accurate by ARMLS
Listing Information presented by local MLS brokerage: Ten-X, local REALTOR®- Arlene Richardson - (888)-952-6393