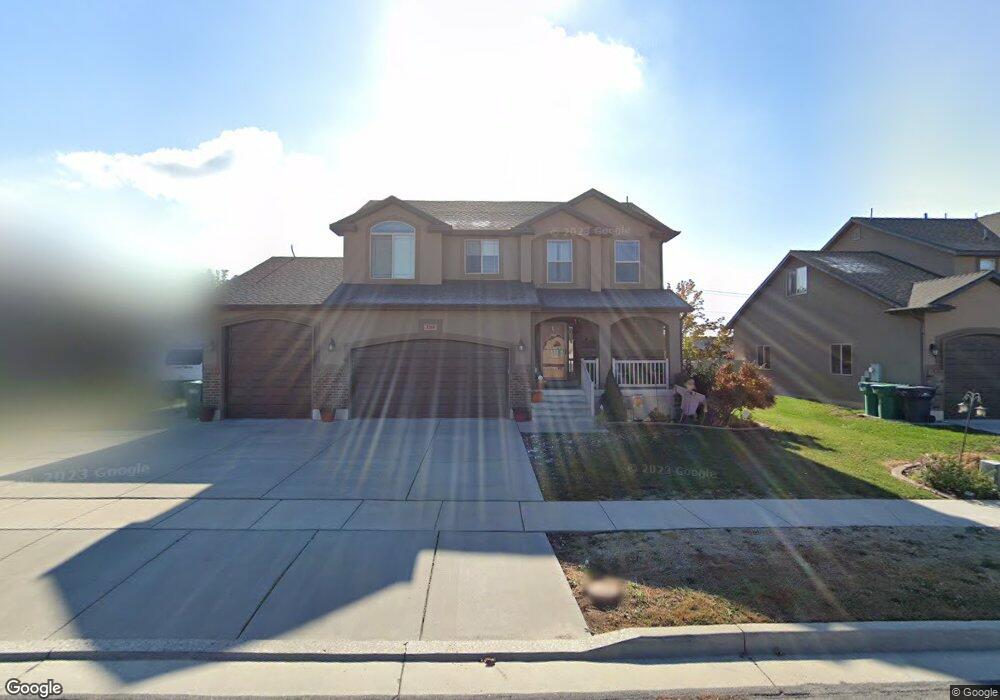
3269 W 1025 N Layton, UT 84041
Estimated Value: $576,148 - $705,000
4
Beds
2
Baths
2,665
Sq Ft
$234/Sq Ft
Est. Value
About This Home
This home is located at 3269 W 1025 N, Layton, UT 84041 and is currently estimated at $622,787, approximately $233 per square foot. 3269 W 1025 N is a home located in Davis County with nearby schools including Sand Springs Elementary School, Legacy Junior High School, and Layton High School.
Ownership History
Date
Name
Owned For
Owner Type
Purchase Details
Closed on
Sep 27, 2010
Sold by
Mike Schultz Construction Inc
Bought by
Olsen Ryan C and Olsen Nicole B
Current Estimated Value
Home Financials for this Owner
Home Financials are based on the most recent Mortgage that was taken out on this home.
Original Mortgage
$248,552
Outstanding Balance
$164,185
Interest Rate
4.37%
Mortgage Type
FHA
Estimated Equity
$458,602
Create a Home Valuation Report for This Property
The Home Valuation Report is an in-depth analysis detailing your home's value as well as a comparison with similar homes in the area
Home Values in the Area
Average Home Value in this Area
Purchase History
| Date | Buyer | Sale Price | Title Company |
|---|---|---|---|
| Olsen Ryan C | -- | Mountain View Title |
Source: Public Records
Mortgage History
| Date | Status | Borrower | Loan Amount |
|---|---|---|---|
| Open | Olsen Ryan C | $248,552 |
Source: Public Records
Tax History Compared to Growth
Tax History
| Year | Tax Paid | Tax Assessment Tax Assessment Total Assessment is a certain percentage of the fair market value that is determined by local assessors to be the total taxable value of land and additions on the property. | Land | Improvement |
|---|---|---|---|---|
| 2025 | $2,866 | $300,851 | $106,211 | $194,640 |
| 2024 | $2,720 | $287,650 | $118,446 | $169,204 |
| 2023 | $2,645 | $493,000 | $115,293 | $377,707 |
| 2022 | $2,902 | $293,700 | $73,391 | $220,309 |
| 2021 | $2,729 | $412,000 | $110,122 | $301,878 |
| 2020 | $2,458 | $356,000 | $92,264 | $263,736 |
| 2019 | $2,503 | $355,000 | $95,783 | $259,217 |
| 2018 | $2,240 | $319,000 | $83,884 | $235,116 |
| 2016 | $2,013 | $147,840 | $32,390 | $115,450 |
| 2015 | $2,028 | $141,405 | $32,390 | $109,015 |
| 2014 | $2,144 | $152,852 | $32,390 | $120,462 |
| 2013 | -- | $127,885 | $28,952 | $98,933 |
Source: Public Records
Map
Nearby Homes