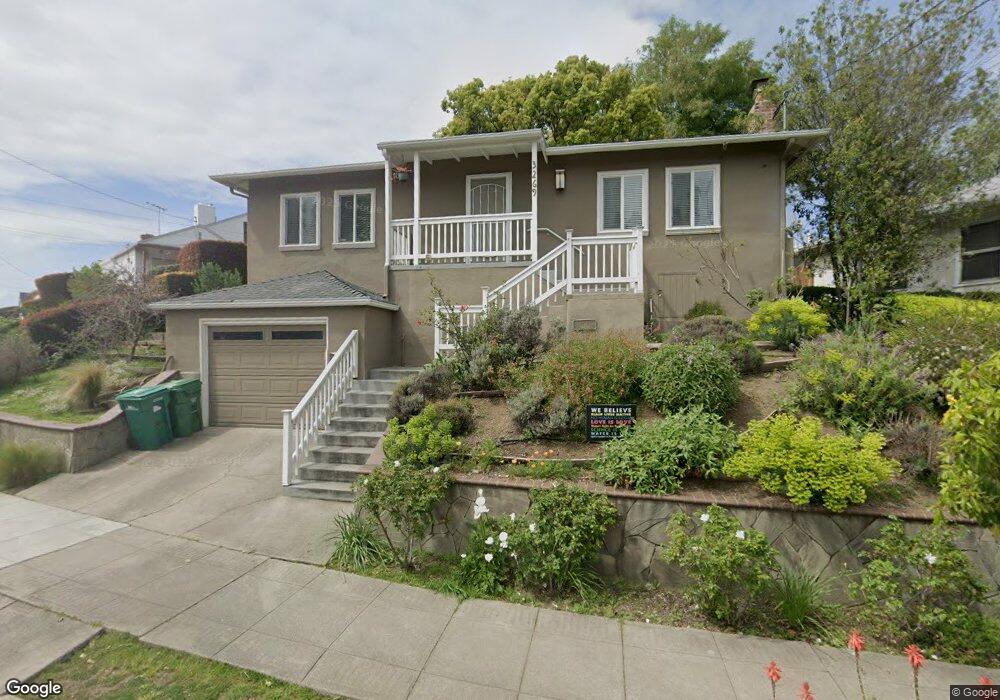
3269 Wyman St Oakland, CA 94619
Maxwell Park NeighborhoodEstimated Value: $816,000 - $913,383
3
Beds
1
Bath
1,222
Sq Ft
$710/Sq Ft
Est. Value
About This Home
This home is located at 3269 Wyman St, Oakland, CA 94619 and is currently estimated at $867,096, approximately $709 per square foot. 3269 Wyman St is a home located in Alameda County with nearby schools including Laurel Elementary School, Frick United Academy of Language, and Skyline High School.
Ownership History
Date
Name
Owned For
Owner Type
Purchase Details
Closed on
Oct 2, 2018
Sold by
Driver Michael S
Bought by
Zils Matthew Joseph
Current Estimated Value
Home Financials for this Owner
Home Financials are based on the most recent Mortgage that was taken out on this home.
Original Mortgage
$789,400
Outstanding Balance
$682,699
Interest Rate
4.5%
Mortgage Type
Purchase Money Mortgage
Estimated Equity
$184,397
Purchase Details
Closed on
Jun 11, 2013
Sold by
Rww Properties Llc
Bought by
Driver Michael S
Home Financials for this Owner
Home Financials are based on the most recent Mortgage that was taken out on this home.
Original Mortgage
$400,000
Interest Rate
3.32%
Mortgage Type
New Conventional
Purchase Details
Closed on
Apr 3, 2013
Sold by
Maynard Michelle M
Bought by
Rww Properties Llc
Purchase Details
Closed on
Nov 18, 2004
Sold by
Smith Allie and Duren Derrick
Bought by
Maynard Michelle M
Home Financials for this Owner
Home Financials are based on the most recent Mortgage that was taken out on this home.
Original Mortgage
$398,000
Interest Rate
5.72%
Mortgage Type
Purchase Money Mortgage
Purchase Details
Closed on
May 7, 2004
Sold by
Carter Amy H and Carter 1991 Revocable Trust
Bought by
Smith Allie and Duren Derrick
Home Financials for this Owner
Home Financials are based on the most recent Mortgage that was taken out on this home.
Original Mortgage
$264,000
Interest Rate
5.99%
Mortgage Type
Construction
Purchase Details
Closed on
Feb 11, 2004
Sold by
Duren Barbara
Bought by
Duren Derrick
Create a Home Valuation Report for This Property
The Home Valuation Report is an in-depth analysis detailing your home's value as well as a comparison with similar homes in the area
Home Values in the Area
Average Home Value in this Area
Purchase History
We collect this data history from publicly available records. To have your information removed, we recommend requesting removal directly through your county’s website.
| Date | Buyer | Sale Price | Title Company |
|---|---|---|---|
| Zils Matthew Joseph | $780,000 | Chicago Title Company | |
| Driver Michael S | $500,000 | Chicago Title Company | |
| Rww Properties Llc | $355,200 | None Available | |
| Maynard Michelle M | $510,000 | Old Republic Title Company | |
| Smith Allie | $240,000 | Old Republic Title Company | |
| Duren Derrick | -- | Old Republic Title Company | |
| Smith Allie | -- | Old Republic Title Company |
Source: Public Records
Mortgage History
We collect this data history from publicly available records. To have your information removed, we recommend requesting removal directly through your county’s website.
| Date | Status | Borrower | Loan Amount |
|---|---|---|---|
| Open | Zils Matthew Joseph | $789,400 | |
| Previous Owner | Driver Michael S | $400,000 | |
| Previous Owner | Maynard Michelle M | $398,000 | |
| Previous Owner | Smith Allie | $264,000 | |
| Closed | Maynard Michelle M | $60,000 |
Source: Public Records
Tax History
| Year | Tax Paid | Tax Assessment Tax Assessment Total Assessment is a certain percentage of the fair market value that is determined by local assessors to be the total taxable value of land and additions on the property. | Land | Improvement |
|---|---|---|---|---|
| 2025 | $12,834 | $882,360 | $261,027 | $621,333 |
| 2024 | $12,834 | $865,060 | $255,909 | $609,151 |
| 2023 | $13,512 | $848,101 | $250,892 | $597,209 |
| 2022 | $13,188 | $831,474 | $245,973 | $585,501 |
| 2021 | $12,685 | $815,172 | $241,151 | $574,021 |
| 2020 | $12,546 | $806,820 | $238,680 | $568,140 |
| 2019 | $11,972 | $780,000 | $234,000 | $546,000 |
| 2018 | $8,570 | $541,124 | $162,337 | $378,787 |
| 2017 | $8,240 | $530,514 | $159,154 | $371,360 |
| 2016 | $7,964 | $520,114 | $156,034 | $364,080 |
| 2015 | $7,920 | $512,304 | $153,691 | $358,613 |
| 2014 | $8,121 | $502,270 | $150,681 | $351,589 |
Source: Public Records
Map
Nearby Homes
- 3261 Wyman St
- 5229 Macarthur Blvd
- 5091 Macarthur Blvd
- 3409 Wyman St
- 3426 Pierson St
- 2924 Morcom Ave
- 3039 Modesto Ave
- 5407 Roberts Ave
- 22 Murdock Ct
- 5922 Camden St
- 25 Redding Place
- 3121 Monticello Ave
- 2907 Seminary Ave
- 3754 Enos Ave
- 3530 Seminary Ave
- 0 Outlook Ave
- 6029 Macarthur Blvd
- 5340 Walnut St
- 4632 Steele St
- 5814 Fleming Ave
Your Personal Tour Guide
Ask me questions while you tour the home.