Estimated Value: $221,000 - $463,000
3
Beds
2
Baths
6
Sq Ft
$49,392/Sq Ft
Est. Value
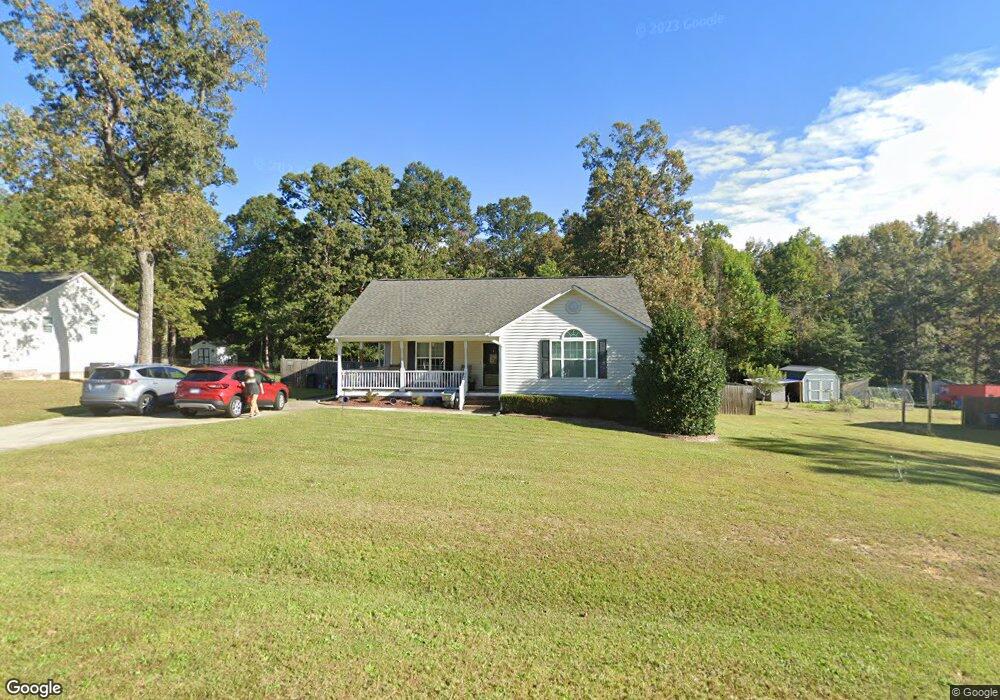
About This Home
This home is located at 327 Bald Eagle Ln, Kenly, NC 27542 and is currently estimated at $296,350, approximately $49,391 per square foot. 327 Bald Eagle Ln is a home located in Johnston County with nearby schools including Princeton Elementary School and Princeton High School.
Ownership History
Date
Name
Owned For
Owner Type
Purchase Details
Closed on
Sep 8, 2022
Sold by
Davis Erick R and Davis Renee Crystal
Bought by
Ward William R and Ward Gretel R
Current Estimated Value
Home Financials for this Owner
Home Financials are based on the most recent Mortgage that was taken out on this home.
Original Mortgage
$100,000
Outstanding Balance
$94,499
Interest Rate
4%
Mortgage Type
VA
Estimated Equity
$201,851
Purchase Details
Closed on
Jan 23, 2008
Sold by
Faith Real Estate Investments Llc
Bought by
Braswell Homes Inc
Home Financials for this Owner
Home Financials are based on the most recent Mortgage that was taken out on this home.
Original Mortgage
$97,520
Interest Rate
6.17%
Mortgage Type
Purchase Money Mortgage
Purchase Details
Closed on
Aug 30, 2007
Sold by
Main Street Development Group Llc
Bought by
Faith Real Estate Investments Llc
Create a Home Valuation Report for This Property
The Home Valuation Report is an in-depth analysis detailing your home's value as well as a comparison with similar homes in the area
Home Values in the Area
Average Home Value in this Area
Purchase History
| Date | Buyer | Sale Price | Title Company |
|---|---|---|---|
| Ward William R | $100,000 | -- | |
| Braswell Homes Inc | $20,000 | None Available | |
| Faith Real Estate Investments Llc | $70,000 | None Available |
Source: Public Records
Mortgage History
| Date | Status | Borrower | Loan Amount |
|---|---|---|---|
| Open | Ward William R | $100,000 | |
| Previous Owner | Braswell Homes Inc | $97,520 |
Source: Public Records
Tax History
| Year | Tax Paid | Tax Assessment Tax Assessment Total Assessment is a certain percentage of the fair market value that is determined by local assessors to be the total taxable value of land and additions on the property. | Land | Improvement |
|---|---|---|---|---|
| 2025 | $1,540 | $242,540 | $45,000 | $197,540 |
| 2024 | $1,135 | $140,140 | $24,000 | $116,140 |
| 2023 | $1,051 | $140,140 | $24,000 | $116,140 |
| 2022 | $1,107 | $140,140 | $24,000 | $116,140 |
| 2021 | $1,107 | $140,140 | $24,000 | $116,140 |
| 2020 | $1,149 | $140,140 | $24,000 | $116,140 |
| 2019 | $1,149 | $140,140 | $24,000 | $116,140 |
| 2018 | $956 | $113,800 | $14,560 | $99,240 |
| 2017 | $956 | $113,800 | $14,560 | $99,240 |
| 2016 | $956 | $113,800 | $14,560 | $99,240 |
| 2015 | $956 | $113,800 | $14,560 | $99,240 |
| 2014 | $956 | $113,800 | $14,560 | $99,240 |
Source: Public Records
Map
Nearby Homes
- 124 Cuddington Rd
- 1215 Cuddington Rd
- 160 Janyce Dr
- 221 Pinkney Church Rd
- 47 Gold Ct
- 43 Gold Ct
- 0 Radford Rd Unit 100535143
- 0 Radford Rd
- 180 Glenwood Place
- 25 Old Pebble Ln
- 610 Fellowship Church Rd
- 612 Fellowship Church Rd
- 608 Fellowship Church Rd
- 136 Fallingbrook Dr
- 103 Hallwood Dr
- 105 Hallwood Dr
- 101 Hallwood Dr
- 201 Hallwood Dr
- 0 S Fred Cir
- 203 Hallwood Dr
- 327 Bald Eagle Ln Unit LT 50
- 349 Bald Eagle Ln
- 349 Bald Eagle Ln Unit LT49
- 307 Bald Eagle Ln
- 369 Bald Eagle Ln
- 369 Bald Eagle Ln Unit lt48
- 55 Weeping Willow Ct
- 0 Weeping Willow Ct Unit 1783220
- 0 Weeping Willow Ct Unit 1783219
- 0 Weeping Willow Ct Unit 1821650
- 0 Weeping Willow Ct Unit 1821649
- 0 Weeping Willow Ct Unit 1705513
- 0 Weeping Willow Ct Unit 1705515
- 0 Weeping Willow Ct Unit 37 TR1821649
- 0 Weeping Willow Ct Unit 41 TR1821650
- 0 Weeping Willow Ct Unit 37 1705515
- 0 Weeping Willow Ct Unit 41 1705513
- 0 Weeping Willow Ct Unit 41 1783220
- 0 Weeping Willow Ct Unit 41 1783219
- 55 Weeping Willow Ct Unit 41
Your Personal Tour Guide
Ask me questions while you tour the home.