Estimated Value: $484,000 - $512,000
3
Beds
3
Baths
2,182
Sq Ft
$228/Sq Ft
Est. Value
About This Home
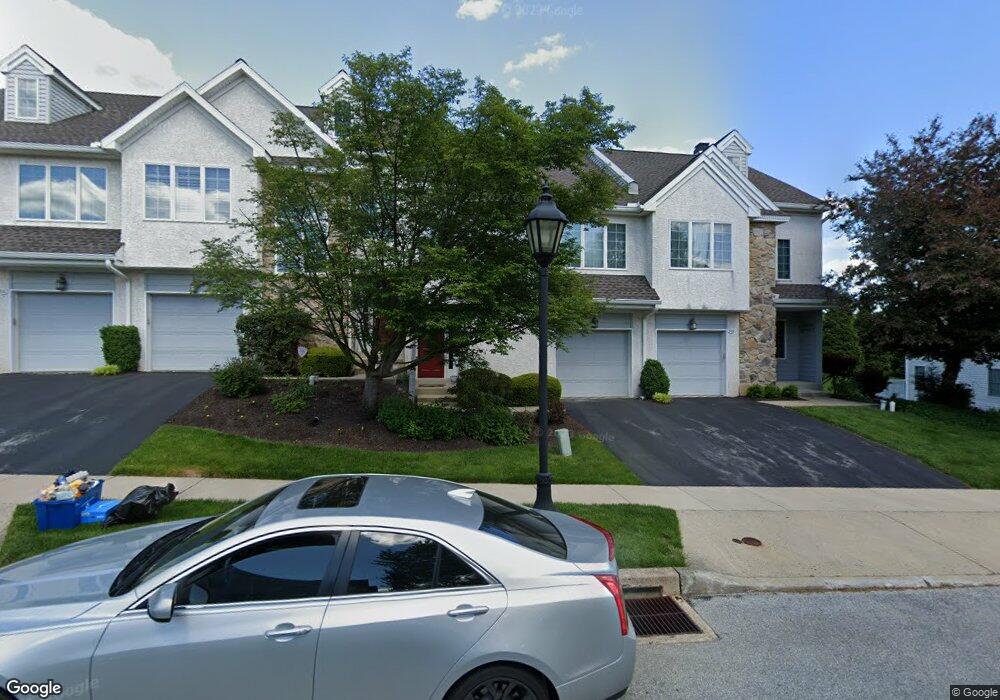
This home is located at 327 Bristol Cir Unit 327, Exton, PA 19341 and is currently estimated at $497,775, approximately $228 per square foot. 327 Bristol Cir Unit 327 is a home located in Chester County with nearby schools including Mary C Howse Elementary School, E.N. Peirce Middle School, and Henderson High School.
Ownership History
Date
Name
Owned For
Owner Type
Purchase Details
Closed on
Apr 15, 2010
Sold by
Englund Meghan M
Bought by
Babcock Andrew N
Current Estimated Value
Home Financials for this Owner
Home Financials are based on the most recent Mortgage that was taken out on this home.
Original Mortgage
$230,000
Outstanding Balance
$153,188
Interest Rate
5%
Mortgage Type
New Conventional
Estimated Equity
$344,587
Purchase Details
Closed on
Sep 18, 2000
Sold by
Rector Charles A and Rector Barbara A
Bought by
Englund Meghan M
Home Financials for this Owner
Home Financials are based on the most recent Mortgage that was taken out on this home.
Original Mortgage
$176,130
Interest Rate
7.71%
Purchase Details
Closed on
Mar 4, 1998
Sold by
Hankin Henrietta and Hankin Robert S
Bought by
Rector Charles A and Rector Barbara A
Home Financials for this Owner
Home Financials are based on the most recent Mortgage that was taken out on this home.
Original Mortgage
$127,370
Interest Rate
6.93%
Create a Home Valuation Report for This Property
The Home Valuation Report is an in-depth analysis detailing your home's value as well as a comparison with similar homes in the area
Home Values in the Area
Average Home Value in this Area
Purchase History
| Date | Buyer | Sale Price | Title Company |
|---|---|---|---|
| Babcock Andrew N | $294,000 | None Available | |
| Englund Meghan M | $190,000 | -- | |
| Rector Charles A | $165,900 | Manito Title Insurance Compa |
Source: Public Records
Mortgage History
| Date | Status | Borrower | Loan Amount |
|---|---|---|---|
| Open | Babcock Andrew N | $230,000 | |
| Previous Owner | Englund Meghan M | $176,130 | |
| Previous Owner | Rector Charles A | $127,370 | |
| Closed | Rector Charles A | $8,000 |
Source: Public Records
Tax History Compared to Growth
Tax History
| Year | Tax Paid | Tax Assessment Tax Assessment Total Assessment is a certain percentage of the fair market value that is determined by local assessors to be the total taxable value of land and additions on the property. | Land | Improvement |
|---|---|---|---|---|
| 2025 | $4,239 | $146,250 | $29,440 | $116,810 |
| 2024 | $4,239 | $146,250 | $29,440 | $116,810 |
| 2023 | $4,051 | $146,250 | $29,440 | $116,810 |
| 2022 | $3,996 | $146,250 | $29,440 | $116,810 |
| 2021 | $3,938 | $146,250 | $29,440 | $116,810 |
| 2020 | $3,911 | $146,250 | $29,440 | $116,810 |
| 2019 | $3,855 | $146,250 | $29,440 | $116,810 |
| 2018 | $3,769 | $146,250 | $29,440 | $116,810 |
| 2017 | $3,683 | $146,250 | $29,440 | $116,810 |
| 2016 | $3,265 | $146,250 | $29,440 | $116,810 |
| 2015 | $3,265 | $146,250 | $29,440 | $116,810 |
| 2014 | $3,265 | $146,250 | $29,440 | $116,810 |
Source: Public Records
Map
Nearby Homes
- 534 Pewter Dr
- 577 Pewter Dr
- 312 Green Cir
- 17 Buttonwood Dr Unit 17
- 491 Orchard Cir
- 420 Oakland Dr
- 324 Conner Dr
- 510 Woodview Dr
- 315 Oak Ln W
- 100 Brookhollow Dr
- 464 E Radnor Ct
- 229 Cambridge Chase Unit 30
- 214 Louis Dr
- 422 Spackman Ln
- 208 Morris Rd
- 81 Four Leaf Dr
- 141 Four Leaf Dr
- 109 Glendale Rd
- 510 Pine Needle Dr
- 233 Birchwood Dr
- 325 Bristol Cir Unit 325
- 329 Bristol Cir Unit 329
- 331 Bristol Cir Unit 231
- 323 Bristol Cir Unit 323
- 321 Bristol Cir Unit 321
- 333 Bristol Cir Unit 333
- 517 Pewter Dr
- 319 Bristol Cir
- 335 Bristol Cir
- 519 Pewter Dr Unit 519
- 317 Bristol Cir Unit 317
- 337 Bristol Cir
- 334 Bristol Cir Unit 334
- 339 Bristol Cir
- 336 Bristol Cir Unit 336
- 523 Pewter Dr Unit 523
- 320 Tapestry Cir
- 322 Tapestry Cir
- 338 Bristol Cir Unit 338
- 525 Pewter Dr Unit 517