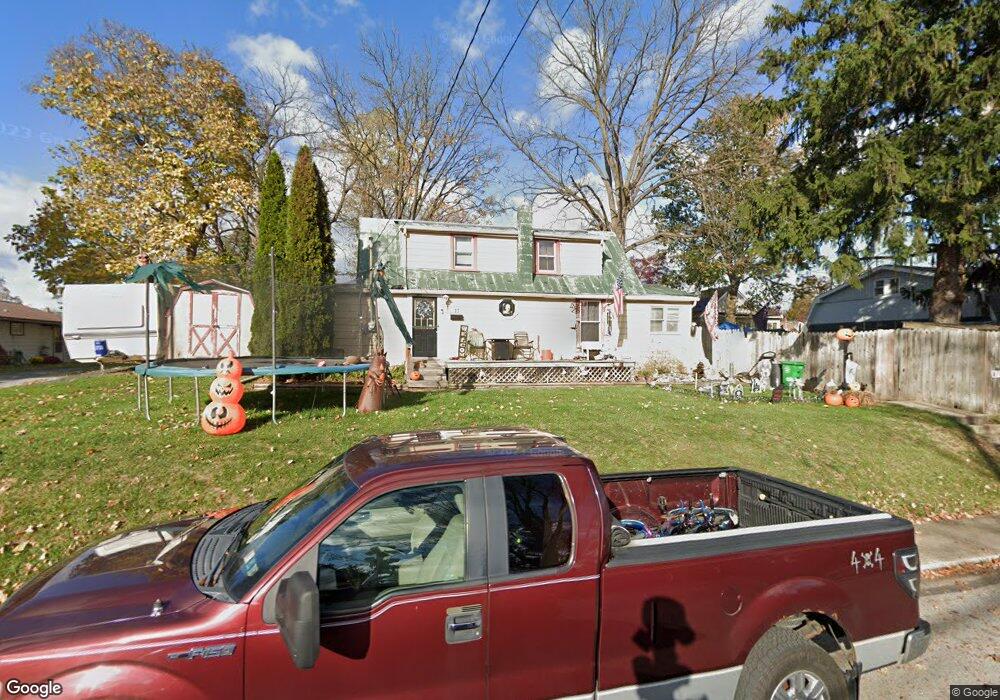
327 F St Carlisle, PA 17013
Estimated Value: $154,000 - $208,000
2
Beds
1
Bath
1,060
Sq Ft
$169/Sq Ft
Est. Value
About This Home
This home is located at 327 F St, Carlisle, PA 17013 and is currently estimated at $178,967, approximately $168 per square foot. 327 F St is a home located in Cumberland County with nearby schools including Bellaire Elementary School, Wilson Middle School, and Carlisle Area High School.
Ownership History
Date
Name
Owned For
Owner Type
Purchase Details
Closed on
Mar 20, 2007
Sold by
Horner Duran
Bought by
Mumper Amanda M
Current Estimated Value
Home Financials for this Owner
Home Financials are based on the most recent Mortgage that was taken out on this home.
Original Mortgage
$94,070
Outstanding Balance
$57,157
Interest Rate
6.33%
Mortgage Type
New Conventional
Estimated Equity
$121,810
Purchase Details
Closed on
Dec 17, 2004
Sold by
Squires Justin
Bought by
Horner Duran
Home Financials for this Owner
Home Financials are based on the most recent Mortgage that was taken out on this home.
Original Mortgage
$64,000
Interest Rate
5.68%
Mortgage Type
New Conventional
Purchase Details
Closed on
Oct 31, 2002
Sold by
Bier Daniel E
Bought by
Squires Justin
Home Financials for this Owner
Home Financials are based on the most recent Mortgage that was taken out on this home.
Original Mortgage
$73,500
Interest Rate
6.09%
Mortgage Type
New Conventional
Create a Home Valuation Report for This Property
The Home Valuation Report is an in-depth analysis detailing your home's value as well as a comparison with similar homes in the area
Home Values in the Area
Average Home Value in this Area
Purchase History
| Date | Buyer | Sale Price | Title Company |
|---|---|---|---|
| Mumper Amanda M | $95,500 | -- | |
| Horner Duran | $80,000 | -- | |
| Squires Justin | $73,500 | -- |
Source: Public Records
Mortgage History
| Date | Status | Borrower | Loan Amount |
|---|---|---|---|
| Open | Mumper Amanda M | $94,070 | |
| Previous Owner | Horner Duran | $64,000 | |
| Previous Owner | Squires Justin | $73,500 |
Source: Public Records
Tax History Compared to Growth
Tax History
| Year | Tax Paid | Tax Assessment Tax Assessment Total Assessment is a certain percentage of the fair market value that is determined by local assessors to be the total taxable value of land and additions on the property. | Land | Improvement |
|---|---|---|---|---|
| 2025 | $2,425 | $103,000 | $16,900 | $86,100 |
| 2024 | $2,356 | $103,000 | $16,900 | $86,100 |
| 2023 | $2,248 | $103,000 | $16,900 | $86,100 |
| 2022 | $2,216 | $103,000 | $16,900 | $86,100 |
| 2021 | $2,185 | $103,000 | $16,900 | $86,100 |
| 2020 | $2,138 | $103,000 | $16,900 | $86,100 |
| 2019 | $2,094 | $103,000 | $16,900 | $86,100 |
| 2018 | $2,049 | $103,000 | $16,900 | $86,100 |
| 2017 | $2,008 | $103,000 | $16,900 | $86,100 |
| 2016 | -- | $103,000 | $16,900 | $86,100 |
| 2015 | -- | $103,000 | $16,900 | $86,100 |
| 2014 | -- | $103,000 | $16,900 | $86,100 |
Source: Public Records
Map
Nearby Homes