327 Green St Lockport, NY 14094
Estimated Value: $84,000 - $185,680
4
Beds
2
Baths
2,292
Sq Ft
$61/Sq Ft
Est. Value
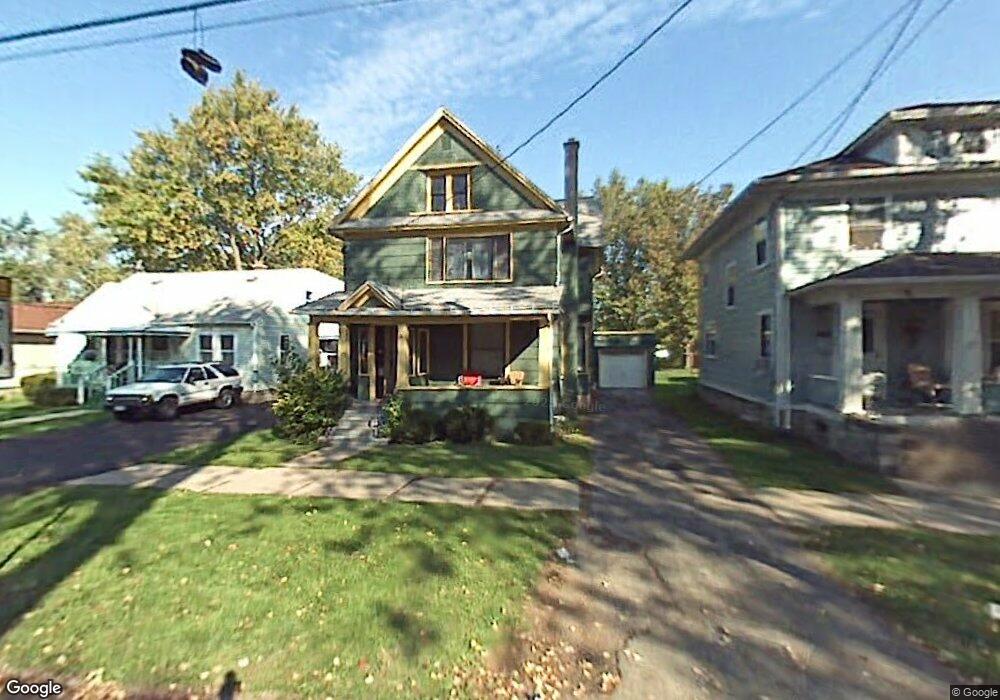
About This Home
This home is located at 327 Green St, Lockport, NY 14094 and is currently estimated at $138,920, approximately $60 per square foot. 327 Green St is a home located in Niagara County with nearby schools including Aaron Mossell Junior High School, Lockport High School, and DeSales Catholic School.
Ownership History
Date
Name
Owned For
Owner Type
Purchase Details
Closed on
Feb 21, 2025
Sold by
Jeffrey-Paul Associates Llc
Bought by
Tp Mess Llc
Current Estimated Value
Purchase Details
Closed on
Sep 1, 2005
Sold by
Zaprowski Jeffrey
Bought by
Jeffrey-Paul Assoc Llc
Purchase Details
Closed on
Dec 19, 2003
Sold by
Us Dept Of Hud
Bought by
Zaprowski Jeffrey
Purchase Details
Closed on
Sep 24, 2003
Sold by
Citimortgage Inc
Bought by
Secretary Of Hud
Purchase Details
Closed on
Aug 19, 2003
Sold by
Allport Eileen
Bought by
Citimortgage Inc
Create a Home Valuation Report for This Property
The Home Valuation Report is an in-depth analysis detailing your home's value as well as a comparison with similar homes in the area
Home Values in the Area
Average Home Value in this Area
Purchase History
| Date | Buyer | Sale Price | Title Company |
|---|---|---|---|
| Tp Mess Llc | $80,000 | None Listed On Document | |
| Jeffrey-Paul Assoc Llc | -- | Frank Dec | |
| Zaprowski Jeffrey | $26,040 | Frank Dec | |
| Secretary Of Hud | -- | Beckman Et Al | |
| Citimortgage Inc | $56,601 | Belkran Et Al |
Source: Public Records
Tax History Compared to Growth
Tax History
| Year | Tax Paid | Tax Assessment Tax Assessment Total Assessment is a certain percentage of the fair market value that is determined by local assessors to be the total taxable value of land and additions on the property. | Land | Improvement |
|---|---|---|---|---|
| 2024 | $3,506 | $129,000 | $4,900 | $124,100 |
| 2023 | $3,467 | $124,000 | $4,900 | $119,100 |
| 2022 | $2,417 | $105,000 | $4,900 | $100,100 |
| 2021 | $2,070 | $52,500 | $4,400 | $48,100 |
| 2020 | $2,026 | $52,500 | $4,400 | $48,100 |
| 2019 | $454 | $52,500 | $4,400 | $48,100 |
| 2018 | $1,465 | $52,500 | $4,400 | $48,100 |
| 2017 | $1,460 | $52,500 | $4,400 | $48,100 |
| 2016 | $1,413 | $52,500 | $4,400 | $48,100 |
| 2015 | -- | $52,500 | $4,400 | $48,100 |
| 2014 | -- | $52,500 | $4,400 | $48,100 |
Source: Public Records
Map
Nearby Homes