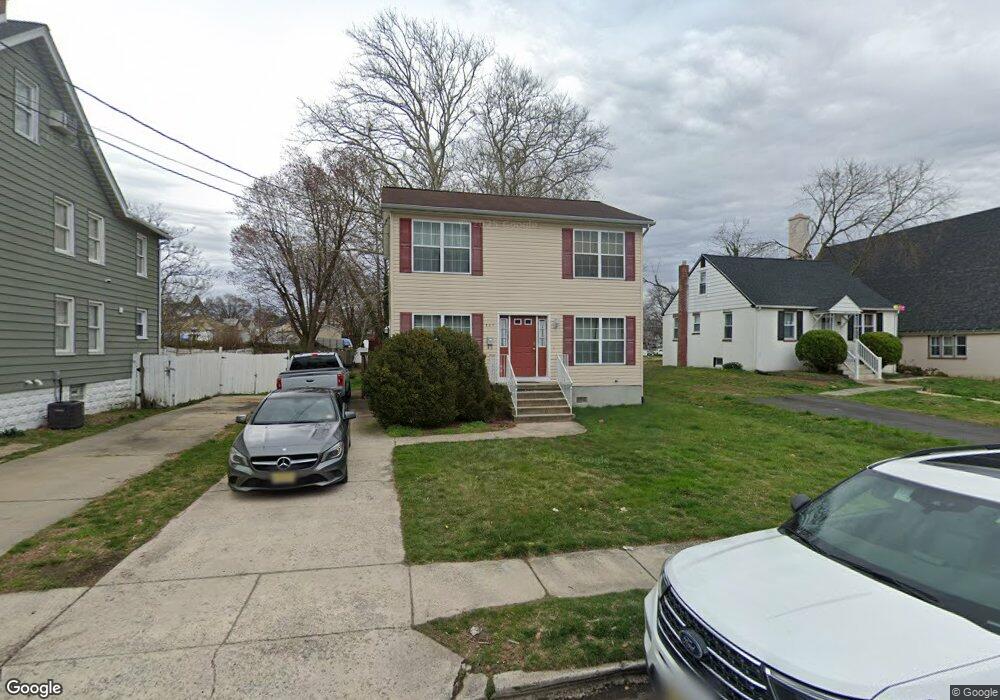
327 High St Westville, NJ 08093
Estimated Value: $268,000 - $375,000
--
Bed
--
Bath
1,595
Sq Ft
$206/Sq Ft
Est. Value
About This Home
This home is located at 327 High St, Westville, NJ 08093 and is currently estimated at $327,858, approximately $205 per square foot. 327 High St is a home located in Gloucester County with nearby schools including Parkview Elementary School, Gateway Regional High School, and Gloucester Catholic Junior Senior High School.
Ownership History
Date
Name
Owned For
Owner Type
Purchase Details
Closed on
Oct 17, 2005
Sold by
Raggio Suzanne
Bought by
Tiliakos Antonios
Current Estimated Value
Home Financials for this Owner
Home Financials are based on the most recent Mortgage that was taken out on this home.
Original Mortgage
$209,650
Outstanding Balance
$111,931
Interest Rate
5.72%
Mortgage Type
FHA
Estimated Equity
$215,927
Purchase Details
Closed on
Oct 19, 2004
Sold by
Densten Doris Galbraith and The Estate Of Mary A Galbraith
Bought by
Raggio Suzanne
Create a Home Valuation Report for This Property
The Home Valuation Report is an in-depth analysis detailing your home's value as well as a comparison with similar homes in the area
Home Values in the Area
Average Home Value in this Area
Purchase History
| Date | Buyer | Sale Price | Title Company |
|---|---|---|---|
| Tiliakos Antonios | $213,000 | Congress | |
| Raggio Suzanne | $12,000 | Franklin Title Agency |
Source: Public Records
Mortgage History
| Date | Status | Borrower | Loan Amount |
|---|---|---|---|
| Open | Tiliakos Antonios | $209,650 |
Source: Public Records
Tax History Compared to Growth
Tax History
| Year | Tax Paid | Tax Assessment Tax Assessment Total Assessment is a certain percentage of the fair market value that is determined by local assessors to be the total taxable value of land and additions on the property. | Land | Improvement |
|---|---|---|---|---|
| 2025 | $8,336 | $153,200 | $38,100 | $115,100 |
| 2024 | $8,069 | $153,200 | $38,100 | $115,100 |
| 2023 | $8,069 | $153,200 | $38,100 | $115,100 |
| 2022 | $7,838 | $153,200 | $38,100 | $115,100 |
| 2021 | $7,697 | $153,200 | $38,100 | $115,100 |
| 2020 | $7,464 | $153,200 | $38,100 | $115,100 |
| 2019 | $7,268 | $153,200 | $38,100 | $115,100 |
| 2018 | $6,954 | $153,200 | $38,100 | $115,100 |
| 2017 | $7,082 | $151,900 | $38,100 | $113,800 |
| 2016 | $6,848 | $151,900 | $38,100 | $113,800 |
| 2015 | $6,541 | $151,900 | $38,100 | $113,800 |
| 2014 | $6,124 | $164,800 | $40,100 | $124,700 |
Source: Public Records
Map
Nearby Homes