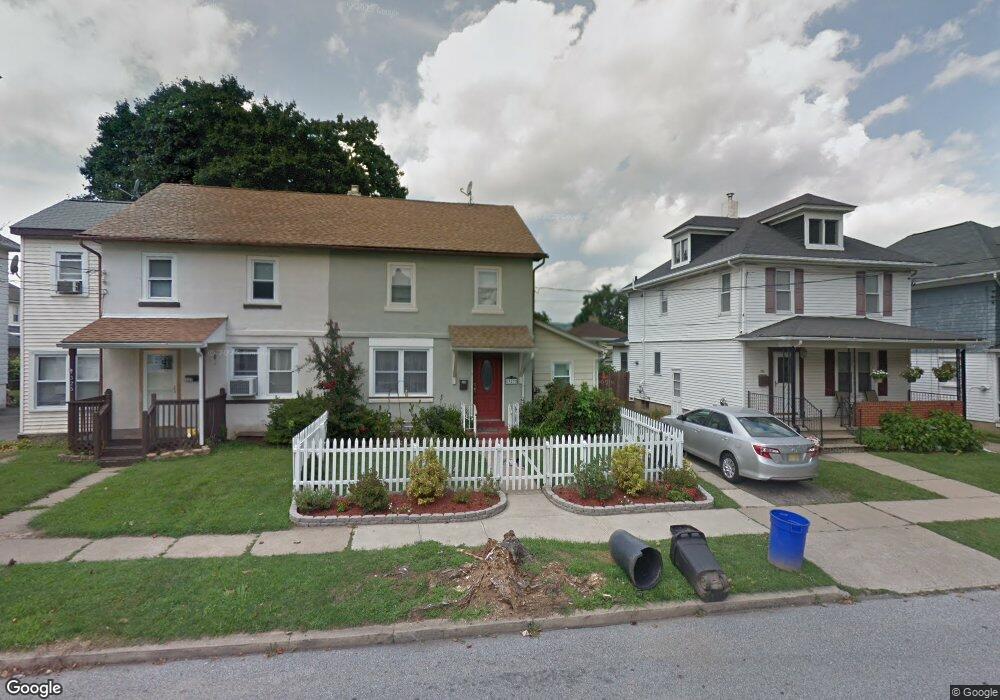
327 Hudson St Phillipsburg, NJ 08865
Estimated Value: $166,045 - $242,000
--
Bed
--
Bath
1,328
Sq Ft
$164/Sq Ft
Est. Value
About This Home
This home is located at 327 Hudson St, Phillipsburg, NJ 08865 and is currently estimated at $217,511, approximately $163 per square foot. 327 Hudson St is a home located in Warren County with nearby schools including Phillipsburg High School, Easton Arts Academy Elementary Cs, and Sts. Philip & James School.
Ownership History
Date
Name
Owned For
Owner Type
Purchase Details
Closed on
Oct 13, 2006
Sold by
Murphy Jacqueline M
Bought by
Blake Marcia
Current Estimated Value
Home Financials for this Owner
Home Financials are based on the most recent Mortgage that was taken out on this home.
Original Mortgage
$139,500
Outstanding Balance
$83,380
Interest Rate
6.49%
Mortgage Type
Purchase Money Mortgage
Estimated Equity
$134,131
Create a Home Valuation Report for This Property
The Home Valuation Report is an in-depth analysis detailing your home's value as well as a comparison with similar homes in the area
Home Values in the Area
Average Home Value in this Area
Purchase History
| Date | Buyer | Sale Price | Title Company |
|---|---|---|---|
| Blake Marcia | $140,000 | First American Title Ins Co |
Source: Public Records
Mortgage History
| Date | Status | Borrower | Loan Amount |
|---|---|---|---|
| Open | Blake Marcia | $139,500 |
Source: Public Records
Tax History Compared to Growth
Tax History
| Year | Tax Paid | Tax Assessment Tax Assessment Total Assessment is a certain percentage of the fair market value that is determined by local assessors to be the total taxable value of land and additions on the property. | Land | Improvement |
|---|---|---|---|---|
| 2025 | $3,022 | $66,500 | $26,900 | $39,600 |
| 2024 | $2,790 | $66,500 | $26,900 | $39,600 |
| 2023 | $2,758 | $66,500 | $26,900 | $39,600 |
| 2022 | $2,758 | $66,500 | $26,900 | $39,600 |
| 2021 | $2,670 | $66,500 | $26,900 | $39,600 |
| 2020 | $2,688 | $66,500 | $26,900 | $39,600 |
| 2019 | $2,647 | $66,500 | $26,900 | $39,600 |
| 2018 | $2,647 | $66,500 | $26,900 | $39,600 |
| 2017 | $2,568 | $64,800 | $26,900 | $37,900 |
| 2016 | $2,529 | $64,800 | $26,900 | $37,900 |
| 2015 | $2,509 | $64,800 | $26,900 | $37,900 |
| 2014 | $2,427 | $64,800 | $26,900 | $37,900 |
Source: Public Records
Map
Nearby Homes