Estimated Value: $155,000 - $284,000
3
Beds
2
Baths
1,728
Sq Ft
$118/Sq Ft
Est. Value
About This Home
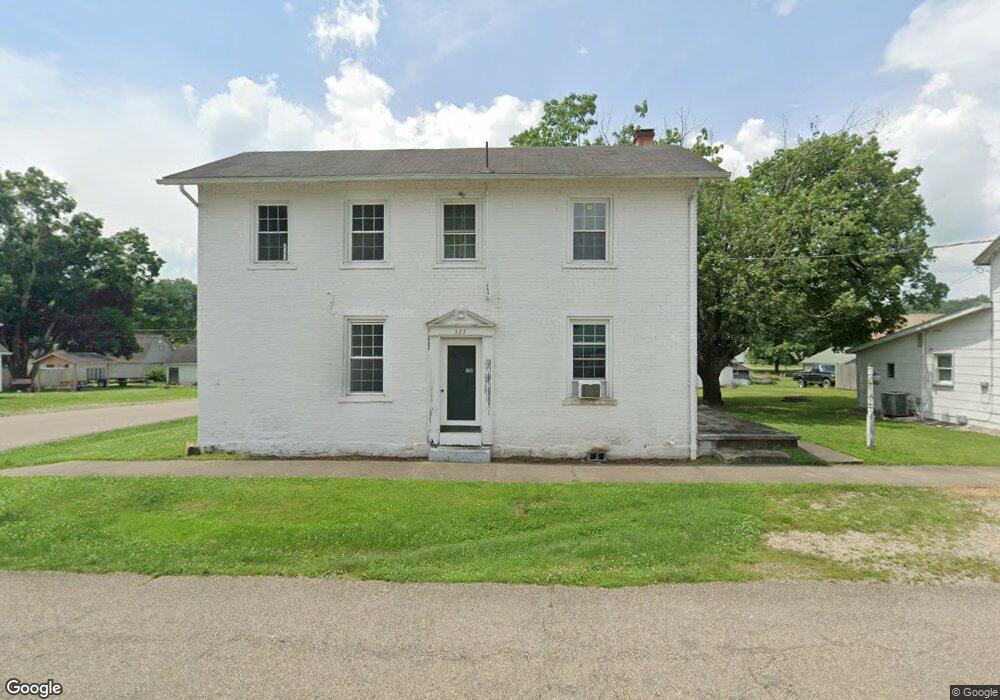
This home is located at 327 Main St, Philo, OH 43771 and is currently estimated at $203,554, approximately $117 per square foot. 327 Main St is a home located in Muskingum County with nearby schools including Philo High School.
Ownership History
Date
Name
Owned For
Owner Type
Purchase Details
Closed on
Nov 7, 2008
Sold by
Secretary Of Housing & Urban Development
Bought by
Cartwright Cameron W
Current Estimated Value
Home Financials for this Owner
Home Financials are based on the most recent Mortgage that was taken out on this home.
Original Mortgage
$36,000
Outstanding Balance
$24,050
Interest Rate
6.87%
Mortgage Type
Purchase Money Mortgage
Estimated Equity
$179,504
Purchase Details
Closed on
Nov 30, 2007
Sold by
May Davis S
Bought by
Hud
Purchase Details
Closed on
Sep 19, 2002
Sold by
Lichtner Frederick E
Bought by
May David S and May Danielle M
Home Financials for this Owner
Home Financials are based on the most recent Mortgage that was taken out on this home.
Original Mortgage
$76,346
Interest Rate
6.4%
Mortgage Type
FHA
Purchase Details
Closed on
Jun 12, 2001
Sold by
Hamilton Marjorie L
Bought by
Lichtner Frederick
Create a Home Valuation Report for This Property
The Home Valuation Report is an in-depth analysis detailing your home's value as well as a comparison with similar homes in the area
Purchase History
| Date | Buyer | Sale Price | Title Company |
|---|---|---|---|
| Cartwright Cameron W | $35,125 | Lakeside Title & Escrow Agen | |
| Hud | $10,000 | Attorney | |
| May David S | $76,950 | -- | |
| Lichtner Frederick | $60,000 | -- |
Source: Public Records
Mortgage History
| Date | Status | Borrower | Loan Amount |
|---|---|---|---|
| Open | Cartwright Cameron W | $36,000 | |
| Previous Owner | May David S | $76,346 |
Source: Public Records
Tax History
| Year | Tax Paid | Tax Assessment Tax Assessment Total Assessment is a certain percentage of the fair market value that is determined by local assessors to be the total taxable value of land and additions on the property. | Land | Improvement |
|---|---|---|---|---|
| 2025 | $834 | $12,110 | $3,395 | $8,715 |
| 2024 | $448 | $12,110 | $3,395 | $8,715 |
| 2023 | $1,228 | $18,095 | $2,765 | $15,330 |
| 2022 | $464 | $11,725 | $2,765 | $8,960 |
| 2021 | $457 | $11,725 | $2,765 | $8,960 |
| 2020 | $398 | $9,765 | $2,310 | $7,455 |
| 2019 | $607 | $15,015 | $2,310 | $12,705 |
| 2018 | $549 | $15,015 | $2,310 | $12,705 |
| 2017 | $431 | $9,485 | $2,310 | $7,175 |
| 2016 | $472 | $10,500 | $2,310 | $8,190 |
| 2015 | $480 | $10,500 | $2,310 | $8,190 |
| 2013 | $448 | $10,500 | $2,310 | $8,190 |
Source: Public Records
Map
Nearby Homes
- 252 Front St
- 134 Main St
- 307 Harris St
- 960 3rd St
- 243 Mill St
- 385 Water St
- 512 North St
- 4145 Old River Rd
- 0 Sealover Hollow Rd
- 7979 Old River Rd
- 3100 Durant Rd
- 0 Durant Rd Unit 5186947
- 3345 Durant Rd
- 1685 Fattler Ridge Rd
- 8285 Old River Rd
- 2630 Wilhelm Rd
- 965 Back Run Rd
- 8950 Gaysport Hill Rd
- 8672 Ridgeview Rd
- 3900 Chandlersville Rd
Your Personal Tour Guide
Ask me questions while you tour the home.