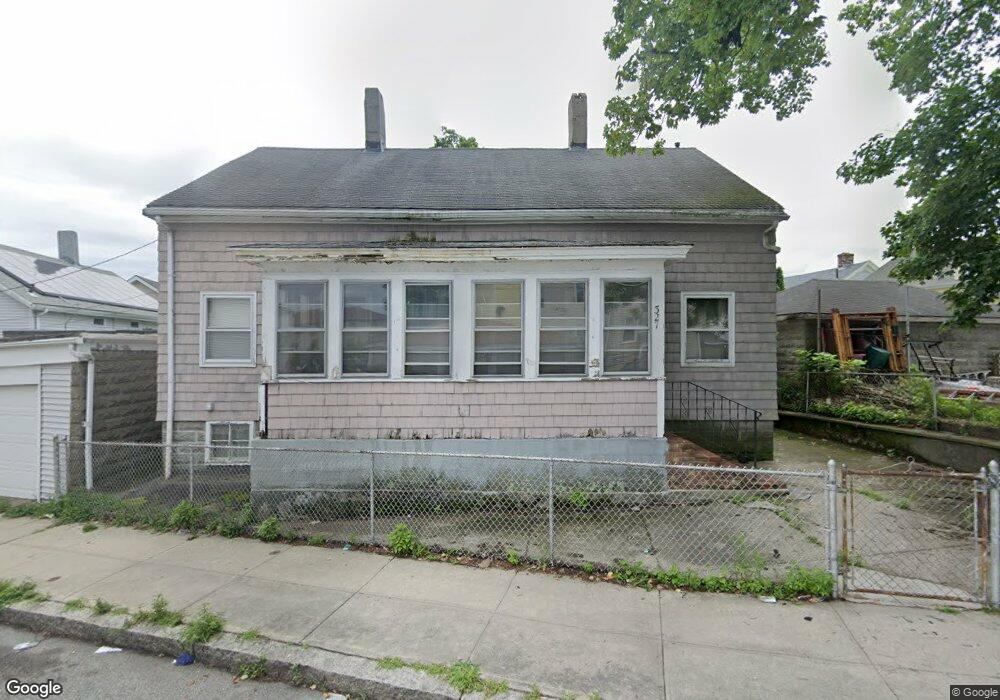
327 Morgan St Fall River, MA 02721
Corky Row NeighborhoodEstimated Value: $294,000 - $356,000
4
Beds
1
Bath
1,473
Sq Ft
$229/Sq Ft
Est. Value
About This Home
This home is located at 327 Morgan St, Fall River, MA 02721 and is currently estimated at $337,298, approximately $228 per square foot. 327 Morgan St is a home located in Bristol County with nearby schools including Henry Lord Community School, B M C Durfee High School, and Argosy Collegiate Charter School.
Ownership History
Date
Name
Owned For
Owner Type
Purchase Details
Closed on
Jun 24, 2025
Sold by
Uchman Dennis E Est and Conn-Uchman
Bought by
Soderstrom Sandy
Current Estimated Value
Purchase Details
Closed on
Jun 20, 2025
Sold by
Uchman Frederick J Est and Uchman
Bought by
Soderstrom Sandy
Purchase Details
Closed on
Jun 19, 2025
Sold by
Uchman Helen A Est and Uchman
Bought by
Soderstrom Sandy
Create a Home Valuation Report for This Property
The Home Valuation Report is an in-depth analysis detailing your home's value as well as a comparison with similar homes in the area
Home Values in the Area
Average Home Value in this Area
Purchase History
| Date | Buyer | Sale Price | Title Company |
|---|---|---|---|
| Soderstrom Sandy | $42,500 | -- | |
| Soderstrom Sandy | $42,500 | -- | |
| Soderstrom Sandy | $42,500 | -- | |
| Soderstrom Sandy | $42,500 | -- | |
| Soderstrom Sandy | $85,000 | -- | |
| Soderstrom Sandy | $85,000 | -- |
Source: Public Records
Tax History
| Year | Tax Paid | Tax Assessment Tax Assessment Total Assessment is a certain percentage of the fair market value that is determined by local assessors to be the total taxable value of land and additions on the property. | Land | Improvement |
|---|---|---|---|---|
| 2025 | $3,437 | $300,200 | $100,500 | $199,700 |
| 2024 | $3,203 | $278,800 | $93,900 | $184,900 |
| 2023 | $2,979 | $242,800 | $78,800 | $164,000 |
| 2022 | $2,988 | $236,800 | $75,000 | $161,800 |
| 2021 | $2,719 | $196,600 | $71,800 | $124,800 |
| 2020 | $2,725 | $188,600 | $69,400 | $119,200 |
| 2019 | $2,667 | $182,900 | $69,400 | $113,500 |
| 2018 | $2,592 | $177,300 | $73,500 | $103,800 |
| 2017 | $2,470 | $176,400 | $73,500 | $102,900 |
| 2016 | $2,567 | $188,300 | $90,000 | $98,300 |
| 2015 | $2,417 | $184,800 | $86,500 | $98,300 |
| 2014 | $2,446 | $194,400 | $96,100 | $98,300 |
Source: Public Records
Map
Nearby Homes
- 377 Hartwell St
- 359 Hartwell St
- 198 John St
- 387 Hartwell St
- 186 John St Unit 3S
- 316 Morgan St
- 347 Hartwell St
- 397 Hartwell St
- 208 John St Unit 210
- 154 John St
- 394 Hartwell St
- 218 John St
- 144 John St
- 407 Hartwell St
- 517 Plymouth Ave
- 337 Hartwell St Unit 1 North
- 337 Hartwell St Unit 1 South
- 337 Hartwell St
- 527 Plymouth Ave Unit 2 North
- 527 Plymouth Ave Unit 1S
Your Personal Tour Guide
Ask me questions while you tour the home.