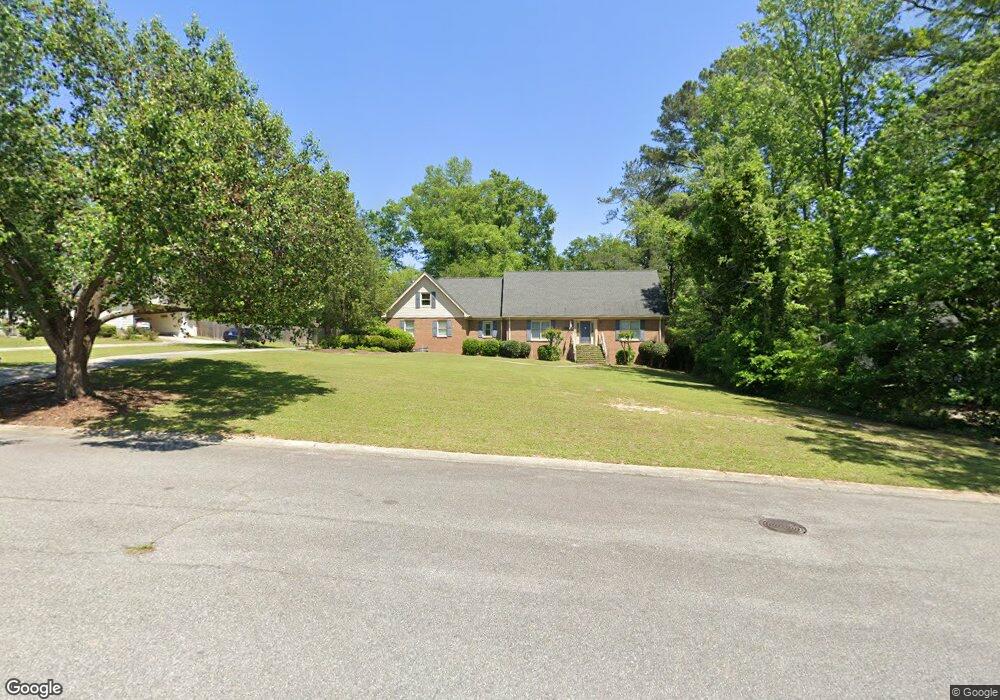
327 Regency Cir Dublin, GA 31021
Estimated Value: $316,772 - $361,000
4
Beds
3
Baths
2,950
Sq Ft
$113/Sq Ft
Est. Value
About This Home
This home is located at 327 Regency Cir, Dublin, GA 31021 and is currently estimated at $334,443, approximately $113 per square foot. 327 Regency Cir is a home located in Laurens County with nearby schools including Susie Dasher, Moore Street School, and Dublin Middle School.
Ownership History
Date
Name
Owned For
Owner Type
Purchase Details
Closed on
Mar 31, 2021
Sold by
Eiland Kenton V
Bought by
Helton Carter Wayne and Helton Hannah Ford
Current Estimated Value
Home Financials for this Owner
Home Financials are based on the most recent Mortgage that was taken out on this home.
Original Mortgage
$202,500
Outstanding Balance
$180,438
Interest Rate
3%
Mortgage Type
New Conventional
Estimated Equity
$154,005
Purchase Details
Closed on
May 27, 2004
Bought by
Eiland Kenton V
Purchase Details
Closed on
Dec 17, 2002
Sold by
Jones Garry L and Jones Amy
Bought by
Dinkheller Kenneth W and Dinkheller Jeanette
Purchase Details
Closed on
May 19, 1997
Sold by
Clements Silous
Bought by
Jones Garry L and Jones Amy
Purchase Details
Closed on
Sep 9, 1909
Bought by
Clements Silous F
Create a Home Valuation Report for This Property
The Home Valuation Report is an in-depth analysis detailing your home's value as well as a comparison with similar homes in the area
Home Values in the Area
Average Home Value in this Area
Purchase History
| Date | Buyer | Sale Price | Title Company |
|---|---|---|---|
| Helton Carter Wayne | -- | -- | |
| Helton Carter Wayne | $225,000 | -- | |
| Eiland Kenton V | $188,500 | -- | |
| Dinkheller Kenneth W | $189,000 | -- | |
| Jones Garry L | $148,000 | -- | |
| Clements Silous F | -- | -- |
Source: Public Records
Mortgage History
| Date | Status | Borrower | Loan Amount |
|---|---|---|---|
| Open | Helton Carter Wayne | $202,500 |
Source: Public Records
Tax History
| Year | Tax Paid | Tax Assessment Tax Assessment Total Assessment is a certain percentage of the fair market value that is determined by local assessors to be the total taxable value of land and additions on the property. | Land | Improvement |
|---|---|---|---|---|
| 2025 | $3,388 | $123,198 | $9,000 | $114,198 |
| 2024 | $3,615 | $114,979 | $9,000 | $105,979 |
| 2023 | $2,455 | $78,373 | $9,000 | $69,373 |
| 2022 | $516 | $78,373 | $9,000 | $69,373 |
| 2021 | $581 | $83,212 | $9,900 | $73,312 |
| 2020 | $582 | $83,212 | $9,900 | $73,312 |
| 2019 | $583 | $83,212 | $9,900 | $73,312 |
| 2018 | $584 | $83,212 | $9,900 | $73,312 |
| 2017 | $584 | $83,212 | $9,900 | $73,312 |
| 2016 | $584 | $83,212 | $9,900 | $73,312 |
| 2015 | $585 | $83,212 | $9,900 | $73,312 |
| 2014 | $424 | $67,925 | $9,000 | $58,925 |
Source: Public Records
Map
Nearby Homes
- 311 Fairmont Dr
- 500 Payne Place
- 0 Brookhaven Dr Unit 10676829
- 0 Brookhaven Dr Unit 18954
- 0 Saint Andrews Dr
- 502 Payne Place
- 504 Payne Place
- 00 Brookhaven Dr
- 101 Red Fox Run
- 305 Ridgecrest Rd
- 100 Cheek Dr
- 206 Ridge Cir
- 0 Fox Ridge Dr Unit 18998
- 239 Brookwood Dr
- 400 Cypress Dr
- 00 Pinehurst Dr
- 1816 Knox St
- 228 Brookwood Dr
- 109 Cedar Creek Dr
- 218 Pinehurst Dr
- 329 Regency Cir
- 317 Fairmont Dr
- 331 Regency Cir
- 328 Regency Cir
- 321 Regency Cir
- 315 Fairmont Dr
- 320 Regency Cir
- 333 Regency Cir
- 312 Regency Cir
- 330 Regency Cir
- 314 Fairmont Dr
- 313 Fairmont Dr
- 319 Regency Cir
- 310 Regency Cir
- 334 Regency Cir
- 317 Regency Cir
- 312 Fairmont Dr
- 335 Regency Cir
- 315 Regency Cir
- 313 Regency Cir
Your Personal Tour Guide
Ask me questions while you tour the home.