Estimated Value: $231,964 - $348,000
3
Beds
1
Bath
1,220
Sq Ft
$218/Sq Ft
Est. Value
About This Home
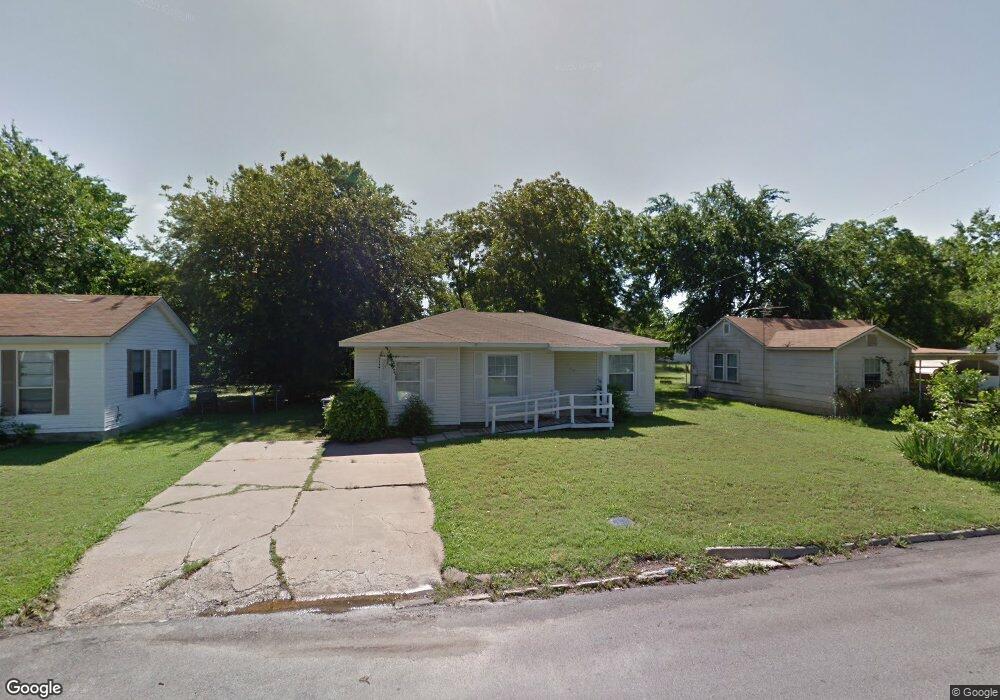
This home is located at 327 S 2nd St, Wylie, TX 75098 and is currently estimated at $266,241, approximately $218 per square foot. 327 S 2nd St is a home located in Collin County with nearby schools including R F Hartman Elementary School, AB Harrison Intermediate School, and Grady Burnett J High School.
Ownership History
Date
Name
Owned For
Owner Type
Purchase Details
Closed on
May 10, 2012
Sold by
Jpmorgan Chase Bank Na
Bought by
Johanson Carlyle J
Current Estimated Value
Purchase Details
Closed on
Jan 3, 2012
Sold by
Sparks Terri
Bought by
Jpmorgan Chase Bank National Association
Purchase Details
Closed on
Oct 30, 2009
Sold by
Tyler Terry L and Tyler Jerry W
Bought by
Sparks Terri
Home Financials for this Owner
Home Financials are based on the most recent Mortgage that was taken out on this home.
Original Mortgage
$87,210
Interest Rate
5.03%
Purchase Details
Closed on
May 12, 2005
Sold by
Tyler Jerry A
Bought by
Tyler Terry L and Tyler Jerry W
Purchase Details
Closed on
Aug 6, 1999
Sold by
Clack Johnnie Lee and Clack Beatrice A
Bought by
Tyler Jerry A and Tyler Terry L
Home Financials for this Owner
Home Financials are based on the most recent Mortgage that was taken out on this home.
Original Mortgage
$37,173
Interest Rate
7.71%
Mortgage Type
Small Business Administration
Create a Home Valuation Report for This Property
The Home Valuation Report is an in-depth analysis detailing your home's value as well as a comparison with similar homes in the area
Home Values in the Area
Average Home Value in this Area
Purchase History
| Date | Buyer | Sale Price | Title Company |
|---|---|---|---|
| Johanson Carlyle J | -- | None Available | |
| Jpmorgan Chase Bank National Association | $49,300 | None Available | |
| Sparks Terri | -- | Rtpt | |
| Tyler Terry L | -- | -- | |
| Tyler Jerry A | -- | -- |
Source: Public Records
Mortgage History
| Date | Status | Borrower | Loan Amount |
|---|---|---|---|
| Previous Owner | Sparks Terri | $87,210 | |
| Previous Owner | Tyler Jerry A | $37,173 |
Source: Public Records
Tax History Compared to Growth
Tax History
| Year | Tax Paid | Tax Assessment Tax Assessment Total Assessment is a certain percentage of the fair market value that is determined by local assessors to be the total taxable value of land and additions on the property. | Land | Improvement |
|---|---|---|---|---|
| 2025 | $4,164 | $203,824 | $70,000 | $133,824 |
| 2024 | $4,164 | $210,832 | $70,000 | $140,832 |
| 2023 | $4,164 | $222,327 | $70,000 | $152,327 |
| 2022 | $4,716 | $214,955 | $60,000 | $154,955 |
| 2021 | $3,621 | $153,909 | $55,000 | $98,909 |
| 2020 | $3,037 | $122,309 | $40,000 | $82,309 |
| 2019 | $3,400 | $129,371 | $40,000 | $89,371 |
| 2018 | $3,832 | $142,296 | $40,000 | $102,296 |
| 2017 | $3,118 | $115,776 | $30,000 | $85,776 |
| 2016 | $2,599 | $93,550 | $20,000 | $73,550 |
| 2015 | $2,249 | $89,993 | $20,000 | $69,993 |
Source: Public Records
Map
Nearby Homes
- 329 S 2nd St
- 327 S 4th St
- 702 S Ballard Ave
- 416 S 1st St
- 301 S 3rd St
- 300 Woodhollow Ct
- 414 Briarwood Dr
- 306 Woodhollow Ct
- 416 Dogwood Dr
- 300 S Cottonbelt Ave Unit 3A
- 205 S Cottonbelt Ave
- 104 Rushcreek Dr
- 104 N 5th St
- 811 Forest Edge Ln
- 804 Memorial Dr
- 217 Cloudcroft Dr
- 1022 Debby Ct
- 307 Memorial Dr
- 903 Mardi Gras Ln
- 303 N 2nd St