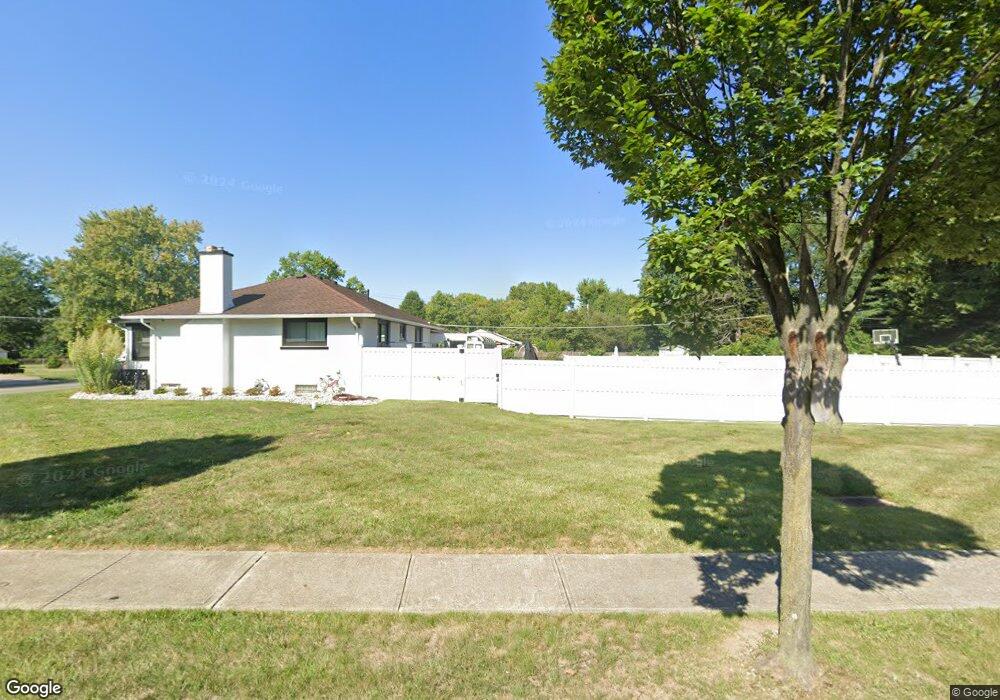
327 Tallman St Groveport, OH 43125
Estimated Value: $218,000 - $260,000
2
Beds
1
Bath
978
Sq Ft
$240/Sq Ft
Est. Value
About This Home
This home is located at 327 Tallman St, Groveport, OH 43125 and is currently estimated at $234,667, approximately $239 per square foot. 327 Tallman St is a home located in Franklin County with nearby schools including Groveport Madison High School, Groveport Community School, and Madison Christian School.
Ownership History
Date
Name
Owned For
Owner Type
Purchase Details
Closed on
Sep 18, 2019
Sold by
Henry Timothy and Henry James
Bought by
Gray Mark A
Current Estimated Value
Purchase Details
Closed on
Jan 23, 2019
Sold by
Estate Of Margaret A Henry
Bought by
Henry Matthew and Henry Timothy
Purchase Details
Closed on
Dec 14, 2009
Sold by
Henry Ronald D and Henry Margaret A
Bought by
Henry Ronald D and Henry Margaret A
Purchase Details
Closed on
May 3, 2006
Sold by
Cesaro Allison and Mildred N Thomas Estate
Bought by
Henry Ronald D and Henry Margaret A
Home Financials for this Owner
Home Financials are based on the most recent Mortgage that was taken out on this home.
Original Mortgage
$90,000
Interest Rate
6.37%
Mortgage Type
Fannie Mae Freddie Mac
Purchase Details
Closed on
Oct 25, 1985
Bought by
Thomas Mildred N
Create a Home Valuation Report for This Property
The Home Valuation Report is an in-depth analysis detailing your home's value as well as a comparison with similar homes in the area
Home Values in the Area
Average Home Value in this Area
Purchase History
| Date | Buyer | Sale Price | Title Company |
|---|---|---|---|
| Gray Mark A | $130,000 | None Available | |
| Henry Matthew | -- | None Available | |
| Henry Ronald D | -- | Attorney | |
| Henry Ronald D | $112,500 | Northwest Title | |
| Thomas Mildred N | -- | -- |
Source: Public Records
Mortgage History
| Date | Status | Borrower | Loan Amount |
|---|---|---|---|
| Previous Owner | Henry Ronald D | $90,000 |
Source: Public Records
Tax History Compared to Growth
Tax History
| Year | Tax Paid | Tax Assessment Tax Assessment Total Assessment is a certain percentage of the fair market value that is determined by local assessors to be the total taxable value of land and additions on the property. | Land | Improvement |
|---|---|---|---|---|
| 2024 | $3,974 | $79,460 | $24,400 | $55,060 |
| 2023 | $3,940 | $79,460 | $24,400 | $55,060 |
| 2022 | $3,263 | $52,510 | $10,050 | $42,460 |
| 2021 | $3,275 | $52,510 | $10,050 | $42,460 |
| 2020 | $3,283 | $52,510 | $10,050 | $42,460 |
| 2019 | $3,150 | $44,390 | $8,370 | $36,020 |
| 2018 | $3,030 | $44,390 | $8,370 | $36,020 |
| 2017 | $3,021 | $44,390 | $8,370 | $36,020 |
| 2016 | $2,868 | $36,410 | $8,090 | $28,320 |
| 2015 | $2,893 | $36,410 | $8,090 | $28,320 |
| 2014 | $2,728 | $36,410 | $8,090 | $28,320 |
| 2013 | $1,228 | $38,325 | $8,505 | $29,820 |
Source: Public Records
Map
Nearby Homes