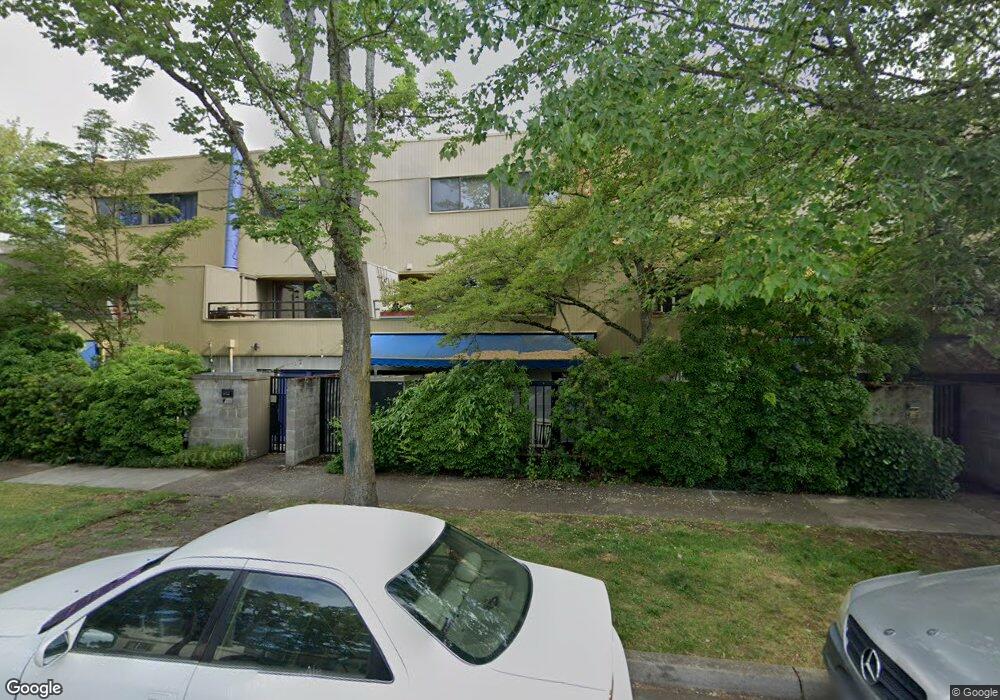
327 W 10th Ave Unit 3 Eugene, OR 97401
Downtown Eugene NeighborhoodEstimated Value: $269,544 - $364,000
1
Bed
1
Bath
780
Sq Ft
$421/Sq Ft
Est. Value
About This Home
This home is located at 327 W 10th Ave Unit 3, Eugene, OR 97401 and is currently estimated at $328,636, approximately $421 per square foot. 327 W 10th Ave Unit 3 is a home located in Lane County with nearby schools including River Road/El Camino del Río Elementary School, Kelly Middle School, and North Eugene High School.
Ownership History
Date
Name
Owned For
Owner Type
Purchase Details
Closed on
Oct 21, 2013
Sold by
Stringer Charles and Stringer Madalyn
Bought by
Russell Scott M
Current Estimated Value
Home Financials for this Owner
Home Financials are based on the most recent Mortgage that was taken out on this home.
Original Mortgage
$124,000
Outstanding Balance
$30,220
Interest Rate
3.48%
Mortgage Type
New Conventional
Estimated Equity
$298,416
Purchase Details
Closed on
Apr 11, 2013
Sold by
Silber Robert C and Silber Georgette L
Bought by
Stringer Charles and Stringer Madalyn
Purchase Details
Closed on
Nov 23, 2011
Sold by
Nelson Catherine A
Bought by
Silber Robert C and Silber Georgette L
Purchase Details
Closed on
Nov 10, 2004
Sold by
Gray Joan E
Bought by
Nelson Catherine A
Home Financials for this Owner
Home Financials are based on the most recent Mortgage that was taken out on this home.
Original Mortgage
$80,726
Interest Rate
5.79%
Mortgage Type
Purchase Money Mortgage
Create a Home Valuation Report for This Property
The Home Valuation Report is an in-depth analysis detailing your home's value as well as a comparison with similar homes in the area
Home Values in the Area
Average Home Value in this Area
Purchase History
| Date | Buyer | Sale Price | Title Company |
|---|---|---|---|
| Russell Scott M | $155,000 | Cascade Title Company | |
| Stringer Charles | $150,000 | Cascade Title Company | |
| Silber Robert C | $136,000 | Western Title & Escrow | |
| Nelson Catherine A | $84,975 | Cascade Title Co |
Source: Public Records
Mortgage History
| Date | Status | Borrower | Loan Amount |
|---|---|---|---|
| Open | Russell Scott M | $124,000 | |
| Previous Owner | Nelson Catherine A | $80,726 |
Source: Public Records
Tax History
| Year | Tax Paid | Tax Assessment Tax Assessment Total Assessment is a certain percentage of the fair market value that is determined by local assessors to be the total taxable value of land and additions on the property. | Land | Improvement |
|---|---|---|---|---|
| 2025 | $2,340 | $120,110 | -- | -- |
| 2024 | $2,311 | $116,612 | -- | -- |
| 2023 | $2,311 | $113,216 | $0 | $0 |
| 2022 | $2,165 | $109,919 | $0 | $0 |
| 2021 | $2,034 | $106,718 | $0 | $0 |
| 2020 | $2,041 | $103,610 | $0 | $0 |
| 2019 | $1,971 | $100,593 | $0 | $0 |
| 2018 | $1,855 | $94,819 | $0 | $0 |
| 2017 | $1,695 | $94,819 | $0 | $0 |
| 2016 | $1,626 | $92,057 | $0 | $0 |
| 2015 | $1,537 | $89,376 | $0 | $0 |
| 2014 | -- | $86,773 | $0 | $0 |
Source: Public Records
Map
Nearby Homes
- 1034 Lawrence St
- 470 W Broadway
- 1275 Jefferson St
- 1313 Lincoln St Unit 503
- 1313 Lincoln St Unit 1005
- 1313 Lincoln St Unit 401
- 650 W 12th Ave Unit 102
- 710 W 11th Ave
- 537 W 14th Ave
- 1375 Olive St Unit 503
- 0 Unknown Unit 480745727
- 577 Madison St
- 561 577 Madison St
- 561 Madison St
- 427 Washington St
- 490 W 4th Ave
- 527 Monroe St
- 996 W 8th Ave
- 960 W 7th Ave
- 1673 Olive Aly
- 315 W 10th Ave Unit 4
- 996 Lincoln St Unit 9
- 992 Lincoln St
- 333 W 10th Ave
- 303 W 10th Ave Unit 10
- 990 Lincoln St Unit 6
- 345 W 10th Ave Unit 1
- 986 Lincoln St Unit 14
- 970 Lincoln St Unit 15
- 980 Lincoln St Unit 11
- 972 Lincoln St
- 982 Lincoln St Unit 12
- 984 Lincoln St Unit 13
- 976 Lincoln St
- 988 Lincoln St
- 978 Lincoln St Unit 19
- 1022 Lincoln St
- 369 W 10th Ave
- 358 W 10th Ave
- 372 W 10th Ave
Your Personal Tour Guide
Ask me questions while you tour the home.