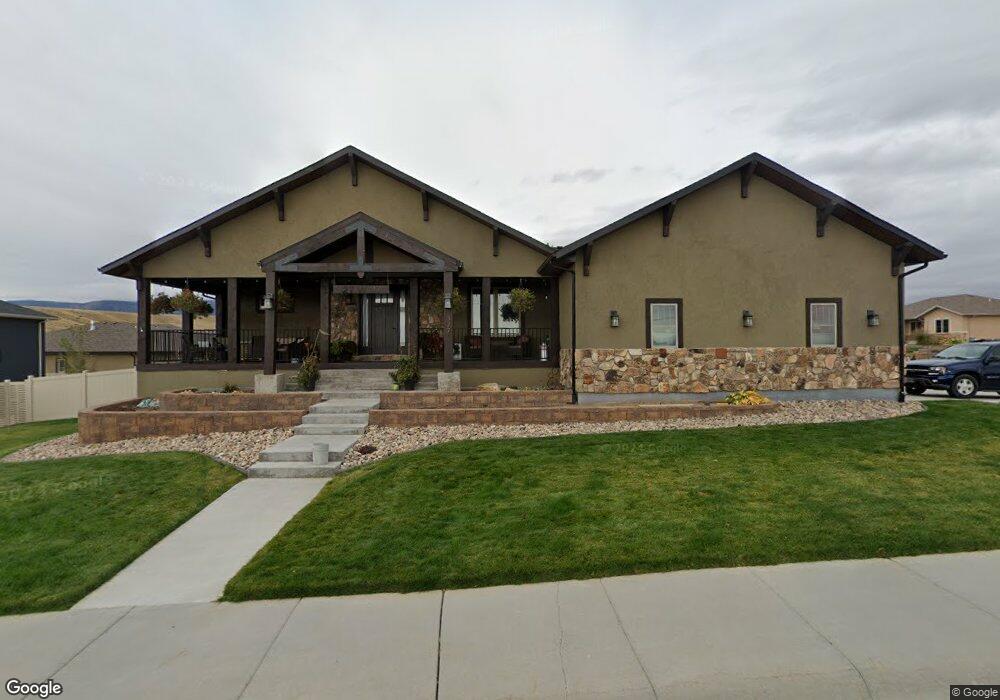
327 W 27th St Unit HOGAN Casper, WY 82601
Central Casper NeighborhoodEstimated Value: $747,000 - $809,107
4
Beds
4
Baths
4,800
Sq Ft
$162/Sq Ft
Est. Value
About This Home
This home is located at 327 W 27th St Unit HOGAN, Casper, WY 82601 and is currently estimated at $778,054, approximately $162 per square foot. 327 W 27th St Unit HOGAN is a home located in Natrona County with nearby schools including St. Anthony Tri-Parish Catholic School and Mountain Road Christian Academy.
Ownership History
Date
Name
Owned For
Owner Type
Purchase Details
Closed on
Jan 4, 2018
Sold by
Trujillo Jonathan A
Bought by
Einer Gary W and Einer Linda C
Current Estimated Value
Purchase Details
Closed on
Sep 25, 2015
Sold by
Wendling Holly R and Wendling Christopher L
Bought by
Trujillo Jonathan A
Home Financials for this Owner
Home Financials are based on the most recent Mortgage that was taken out on this home.
Original Mortgage
$398,400
Interest Rate
3.99%
Mortgage Type
New Conventional
Purchase Details
Closed on
Apr 27, 2015
Sold by
Wendling Christopher L and Wendling Holly R
Bought by
Linlog Llc
Purchase Details
Closed on
Aug 14, 2013
Bought by
Wendling Christopher L and Wendling Holly R
Create a Home Valuation Report for This Property
The Home Valuation Report is an in-depth analysis detailing your home's value as well as a comparison with similar homes in the area
Home Values in the Area
Average Home Value in this Area
Purchase History
| Date | Buyer | Sale Price | Title Company |
|---|---|---|---|
| Einer Gary W | -- | American Title Agency | |
| Trujillo Jonathan A | -- | First American Title | |
| Wendling Christopher L | -- | First American Title | |
| Trujillo Jonathan A | -- | First American Title | |
| Wendling Christopher L | -- | First American Title | |
| Linlog Llc | -- | Private Party | |
| Linlog Llc | -- | Private Party | |
| Wendling Christopher L | -- | -- |
Source: Public Records
Mortgage History
| Date | Status | Borrower | Loan Amount |
|---|---|---|---|
| Previous Owner | Trujillo Jonathan A | $398,400 | |
| Previous Owner | Trujillo Jonathan A | $49,800 |
Source: Public Records
Tax History Compared to Growth
Tax History
| Year | Tax Paid | Tax Assessment Tax Assessment Total Assessment is a certain percentage of the fair market value that is determined by local assessors to be the total taxable value of land and additions on the property. | Land | Improvement |
|---|---|---|---|---|
| 2025 | $3,149 | $43,853 | $5,205 | $38,648 |
| 2024 | $4,291 | $59,749 | $10,201 | $49,548 |
| 2023 | $4,470 | $61,326 | $9,538 | $51,788 |
| 2022 | $3,847 | $52,784 | $9,725 | $43,059 |
| 2021 | $3,452 | $47,364 | $7,852 | $39,512 |
| 2020 | $3,806 | $52,218 | $12,967 | $39,251 |
| 2019 | $3,738 | $51,277 | $6,743 | $44,534 |
| 2018 | $3,542 | $48,592 | $6,743 | $41,849 |
| 2017 | $3,608 | $49,499 | $8,068 | $41,431 |
| 2015 | $3,336 | $48,764 | $8,068 | $40,696 |
| 2014 | $369 | $8,068 | $8,068 | $0 |
Source: Public Records
Map
Nearby Homes
- 2819 Palmer Dr
- 2732 Player Dr
- 2951 Player Dr
- 3127 Palmer Dr
- 1008 W 25th St
- 2665 Allendale Blvd
- 2746 S Odell Ave
- 2726 S Odell Ave
- 1641 Brentwood Dr
- 1945 S Chestnut St
- 1701 Brentwood Dr
- 2631 Navarre Rd
- 1927 S Cedar St
- Lots 1-16 Mckinley Heights
- 3823 S Poplar St
- 0 Wyoming Blvd
- 1828 S Poplar St
- 2109 S Mckinley St
- 1224 S Mckinley St
- 1606 S Oak St
- 327 W 27th St
- 2715 Hogan Dr
- 313 W 27th St
- 2716 Nicklaus Dr Unit 27th
- 2702 Hogan Dr
- 2714 Hogan Dr
- 2727 Hogan Dr
- 314 W 27th St
- 2728 Nicklaus Dr
- 2728 Nicklaus Dr Unit 27th St.
- 2705 Nicklaus Dr
- 240 W 27th St
- 2726 Hogan Dr
- 2717 Nicklaus Dr
- 2804 Nicklaus Dr
- 2803 Hogan Dr
- 2803 Hogan Dr Unit West 29th Street
- 226 W 27th St
- 416 & 328 W 27th St
- 138 W 27th St