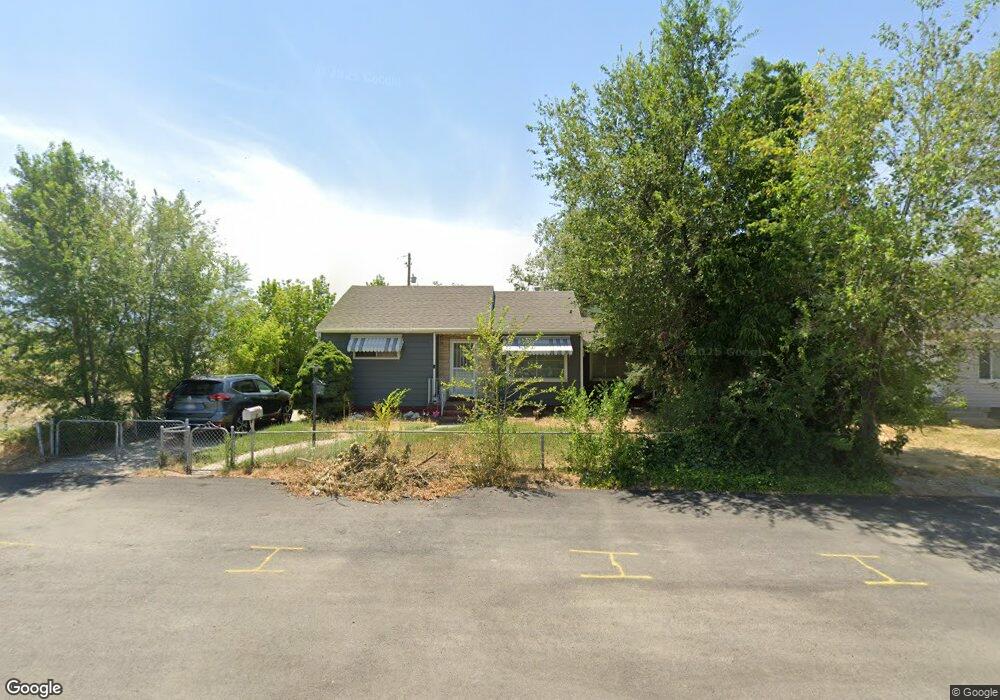
327 W Archard Ave South Salt Lake, UT 84115
Estimated Value: $345,000 - $408,000
2
Beds
1
Bath
895
Sq Ft
$421/Sq Ft
Est. Value
About This Home
This home is located at 327 W Archard Ave, South Salt Lake, UT 84115 and is currently estimated at $376,500, approximately $420 per square foot. 327 W Archard Ave is a home located in Salt Lake County with nearby schools including Granite Park Jr High School, Roosevelt Continuation School, and Cottonwood High School.
Ownership History
Date
Name
Owned For
Owner Type
Purchase Details
Closed on
Jul 8, 2021
Sold by
Ernest Matthew L and Ernest Roberta S
Bought by
Thomas Family Brands Llc
Current Estimated Value
Purchase Details
Closed on
Oct 29, 2012
Sold by
Utah Houing Corp
Bought by
The Secretatry Of Hosing And Urbn Develo
Purchase Details
Closed on
Apr 27, 2010
Sold by
Holly J & Launa D Ernest Family Llc
Bought by
Ernest Matthew L and Ernest Roberta S
Home Financials for this Owner
Home Financials are based on the most recent Mortgage that was taken out on this home.
Original Mortgage
$109,000
Interest Rate
4.92%
Mortgage Type
Seller Take Back
Purchase Details
Closed on
Sep 13, 2006
Sold by
Burroughs Carolyn and Banks Eugene C
Bought by
Holly J & Launa D Ernest Family Llc
Create a Home Valuation Report for This Property
The Home Valuation Report is an in-depth analysis detailing your home's value as well as a comparison with similar homes in the area
Home Values in the Area
Average Home Value in this Area
Purchase History
| Date | Buyer | Sale Price | Title Company |
|---|---|---|---|
| Thomas Family Brands Llc | -- | Meridian Title | |
| The Secretatry Of Hosing And Urbn Develo | -- | Lincoln Title | |
| Ernest Matthew L | -- | None Available | |
| Holly J & Launa D Ernest Family Llc | -- | First American Title |
Source: Public Records
Mortgage History
| Date | Status | Borrower | Loan Amount |
|---|---|---|---|
| Previous Owner | Ernest Matthew L | $109,000 |
Source: Public Records
Tax History Compared to Growth
Tax History
| Year | Tax Paid | Tax Assessment Tax Assessment Total Assessment is a certain percentage of the fair market value that is determined by local assessors to be the total taxable value of land and additions on the property. | Land | Improvement |
|---|---|---|---|---|
| 2025 | $2,021 | $321,300 | $109,100 | $212,200 |
| 2024 | $2,021 | $316,900 | $103,300 | $213,600 |
| 2023 | $1,841 | $285,800 | $99,300 | $186,500 |
| 2022 | $1,878 | $289,100 | $97,400 | $191,700 |
| 2021 | $1,419 | $213,100 | $74,900 | $138,200 |
| 2020 | $1,361 | $194,900 | $66,800 | $128,100 |
| 2019 | $185 | $197,100 | $63,000 | $134,100 |
| 2018 | $1,235 | $164,900 | $63,000 | $101,900 |
| 2017 | $990 | $138,100 | $63,000 | $75,100 |
| 2016 | $948 | $130,900 | $53,000 | $77,900 |
| 2015 | $1,066 | $137,500 | $64,100 | $73,400 |
| 2014 | $1,029 | $130,400 | $62,800 | $67,600 |
Source: Public Records
Map
Nearby Homes
- 3387 S Kinnell Dr
- 176 W Finlay Dr
- 3562 S Main St
- 162 Barry Links Way
- 3464 S Forres Ct
- 3468 S 200 E
- 185 E Majestic Elms Place
- 116 E Helm Ave
- 168 E Helm Ave
- 267 E Millpoint Place
- 3426 S 300 E
- 3438 S 300 E
- 241 E Crestone Ave Unit 16
- 3434 S 300 E
- 3428 S 300 E
- 3430 S 300 E
- 3510 S 300 E Unit E
- 311 E 3360 S
- 3618 S 300 E Unit B2
- 134 Gardena Ave
- 335 W Archard Ave
- 321 W Archard Ave
- 321 W Archard Ave
- 322 W Archard Ave
- 328 Archard Ave
- 335 Archard Ave
- 334 W Archard Ave
- 334 W Mary Etta Ave
- 322 W Mary Etta Ave
- 3362 S 300 W
- 328 Mary Etta Ave
- 3374 S 300 W
- 334 Mary Etta Ave
- 321 W Mary Etta Ave
- 335 W Mary Etta Ave
- 3330 S 300 W Unit B
- 3396 S 300 W
- 329 Mary Etta Ave
- 3404 S 300 W
- 3414 S 300 W