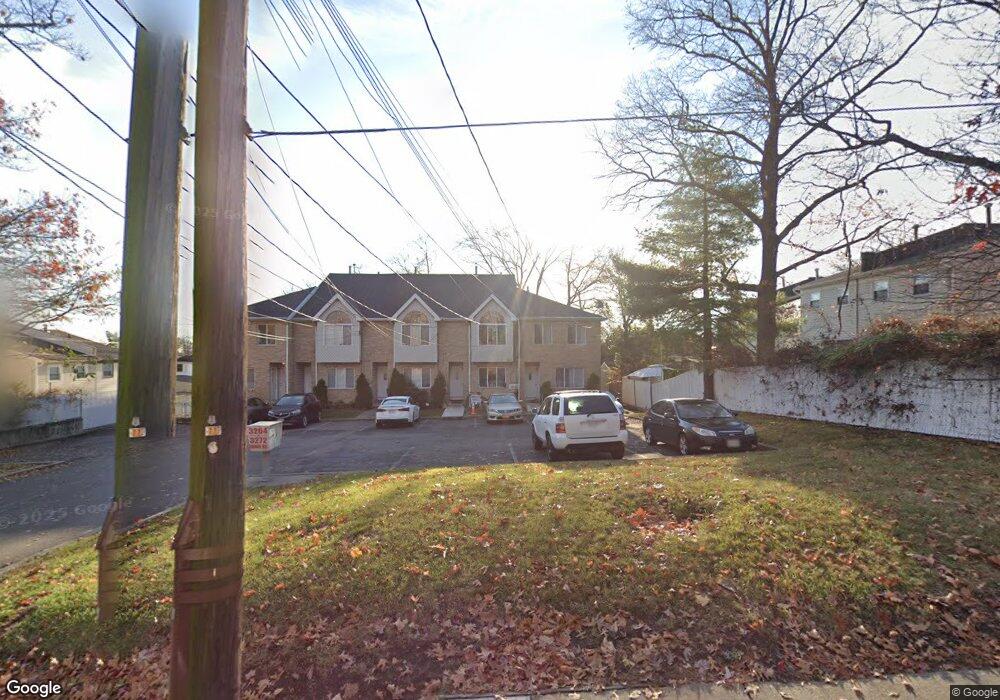
3270 Amboy Rd Unit 3272 Staten Island, NY 10306
Bay Terrace NeighborhoodEstimated Value: $748,154 - $986,000
--
Bed
--
Bath
2,100
Sq Ft
$428/Sq Ft
Est. Value
About This Home
This home is located at 3270 Amboy Rd Unit 3272, Staten Island, NY 10306 and is currently estimated at $897,789, approximately $427 per square foot. 3270 Amboy Rd Unit 3272 is a home located in Richmond County with nearby schools including P.S. 50 Frank Hankinson School, Myra S. Barnes Intermediate School 24, and New Dorp High School.
Ownership History
Date
Name
Owned For
Owner Type
Purchase Details
Closed on
Jan 31, 2019
Sold by
Bay Gardens Apartments Llc
Bought by
Farina Gabriel
Current Estimated Value
Purchase Details
Closed on
Feb 28, 2013
Sold by
Kelly Robert and Farina Charles
Bought by
Bay Gardens Apartments Llc
Home Financials for this Owner
Home Financials are based on the most recent Mortgage that was taken out on this home.
Original Mortgage
$90,259
Interest Rate
3.54%
Mortgage Type
Purchase Money Mortgage
Purchase Details
Closed on
Feb 28, 2007
Sold by
Another Corp
Bought by
Kelly Robert and Farina Charles
Home Financials for this Owner
Home Financials are based on the most recent Mortgage that was taken out on this home.
Original Mortgage
$270,000
Interest Rate
6.49%
Mortgage Type
Purchase Money Mortgage
Purchase Details
Closed on
Nov 12, 1979
Sold by
Samala Ahmed Dr Naeem and Samala Swamy Dr
Bought by
Another Corp
Create a Home Valuation Report for This Property
The Home Valuation Report is an in-depth analysis detailing your home's value as well as a comparison with similar homes in the area
Home Values in the Area
Average Home Value in this Area
Purchase History
| Date | Buyer | Sale Price | Title Company |
|---|---|---|---|
| Farina Gabriel | -- | First American Title Ins Co | |
| Bay Gardens Apartments Llc | -- | First American Title Ins Co | |
| Kelly Robert | -- | National Granite Title Insur | |
| Another Corp | $160,000 | -- |
Source: Public Records
Mortgage History
| Date | Status | Borrower | Loan Amount |
|---|---|---|---|
| Previous Owner | Bay Gardens Apartments Llc | $90,259 | |
| Previous Owner | Kelly Robert | $270,000 |
Source: Public Records
Tax History Compared to Growth
Tax History
| Year | Tax Paid | Tax Assessment Tax Assessment Total Assessment is a certain percentage of the fair market value that is determined by local assessors to be the total taxable value of land and additions on the property. | Land | Improvement |
|---|---|---|---|---|
| 2025 | $7,247 | $44,580 | $7,412 | $37,168 |
| 2024 | $7,247 | $42,720 | $7,297 | $35,423 |
| 2023 | $7,247 | $36,080 | $6,178 | $29,902 |
| 2022 | $7,272 | $44,880 | $8,640 | $36,240 |
| 2021 | $7,109 | $40,740 | $8,640 | $32,100 |
| 2020 | $6,746 | $39,480 | $8,640 | $30,840 |
| 2019 | $6,290 | $35,760 | $8,640 | $27,120 |
| 2018 | $6,129 | $30,067 | $7,718 | $22,349 |
| 2017 | $6,083 | $29,839 | $8,046 | $21,793 |
| 2016 | $5,627 | $28,150 | $7,663 | $20,487 |
| 2015 | -- | $26,558 | $8,078 | $18,480 |
| 2014 | -- | $25,056 | $8,440 | $16,616 |
Source: Public Records
Map
Nearby Homes
- 2075 N Railroad Ave
- 55 O'Gorman Ave
- 92 Twombly Ave
- 12 Benton Ct
- 26 Benton Ct
- 238 Montreal Ave
- 100 Savoy St Unit 1, 39, 43, 45, 46
- 14 Savoy St Unit 14
- 16 Savoy St Unit 16
- 148 Hopkins Ave
- 3438 Amboy Rd Unit 3438
- 18 Atmore Place
- 38 Corona Ave
- 1915 N Railroad Ave
- 133 Durant Ave
- 41 Croft Ct
- 15 Corona Ave
- 8 Croft Ct
- 15 Fuller Ct Unit A
- 3461 Amboy Rd Unit 1J